Immigrants from Canada vs Immigrants from Afghanistan In Labor Force | Age 35-44
COMPARE
Immigrants from Canada
Immigrants from Afghanistan
In Labor Force | Age 35-44
In Labor Force | Age 35-44 Comparison
Immigrants from Canada
Immigrants from Afghanistan
84.2%
IN LABOR FORCE | AGE 35-44
19.6/ 100
METRIC RATING
205th/ 347
METRIC RANK
84.4%
IN LABOR FORCE | AGE 35-44
52.7/ 100
METRIC RATING
169th/ 347
METRIC RANK
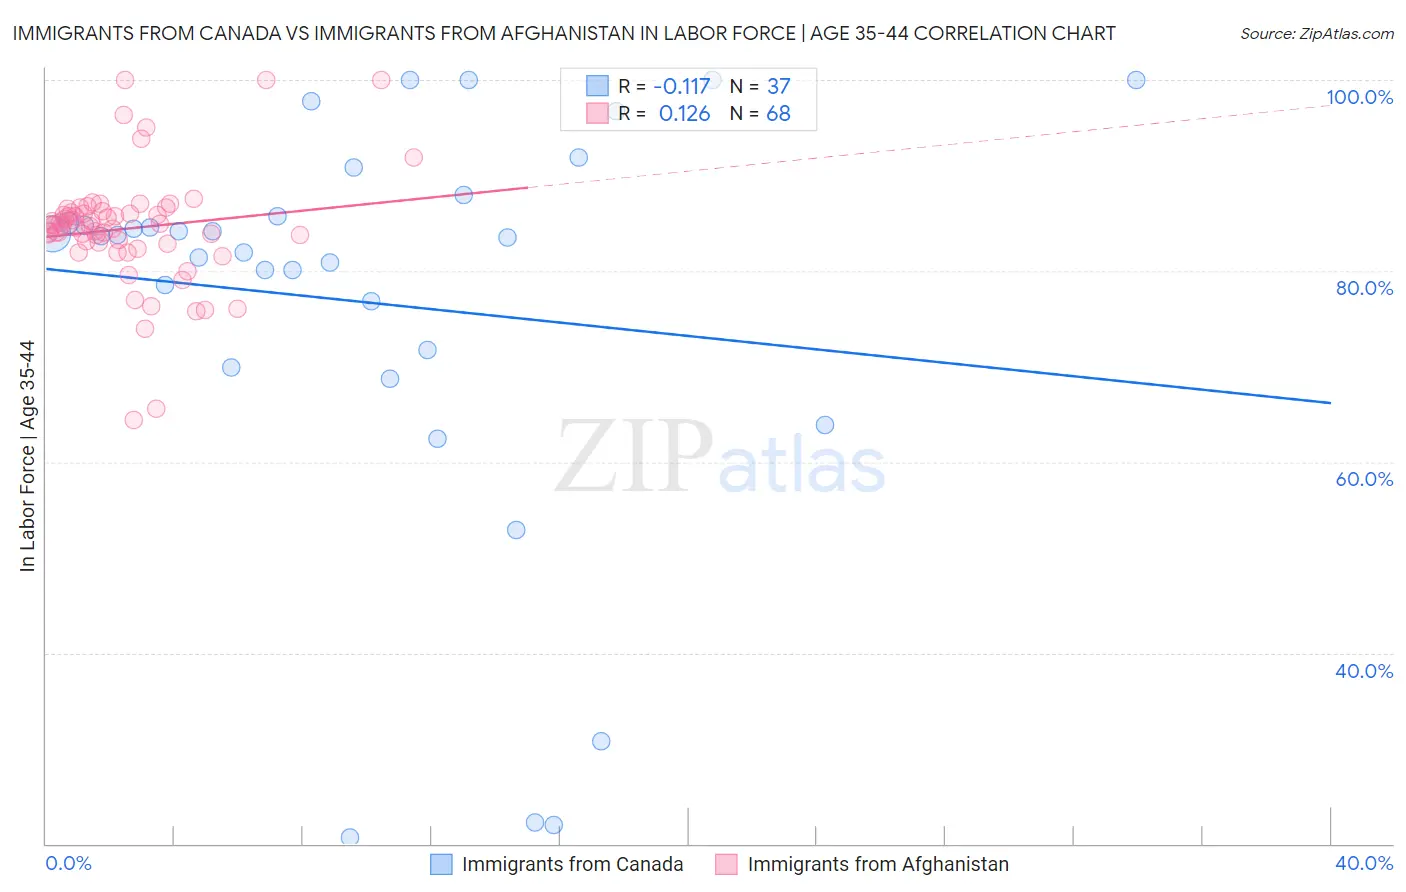
Immigrants from Canada vs Immigrants from Afghanistan In Labor Force | Age 35-44 Correlation Chart
The statistical analysis conducted on geographies consisting of 459,143,977 people shows a poor negative correlation between the proportion of Immigrants from Canada and labor force participation rate among population between the ages 35 and 44 in the United States with a correlation coefficient (R) of -0.117 and weighted average of 84.2%. Similarly, the statistical analysis conducted on geographies consisting of 147,638,849 people shows a poor positive correlation between the proportion of Immigrants from Afghanistan and labor force participation rate among population between the ages 35 and 44 in the United States with a correlation coefficient (R) of 0.126 and weighted average of 84.4%, a difference of 0.25%.
In Labor Force | Age 35-44 Correlation Summary
| Measurement | Immigrants from Canada | Immigrants from Afghanistan |
| Minimum | 20.7% | 64.4% |
| Maximum | 100.0% | 100.0% |
| Range | 79.3% | 35.6% |
| Mean | 76.7% | 84.4% |
| Median | 83.6% | 84.8% |
| Interquartile 25% (IQ1) | 70.8% | 82.9% |
| Interquartile 75% (IQ3) | 86.8% | 86.2% |
| Interquartile Range (IQR) | 16.0% | 3.3% |
| Standard Deviation (Sample) | 21.5% | 6.1% |
| Standard Deviation (Population) | 21.2% | 6.1% |
Similar Demographics by In Labor Force | Age 35-44
Demographics Similar to Immigrants from Canada by In Labor Force | Age 35-44
In terms of in labor force | age 35-44, the demographic groups most similar to Immigrants from Canada are Canadian (84.2%, a difference of 0.0%), Immigrants from Costa Rica (84.2%, a difference of 0.0%), Laotian (84.2%, a difference of 0.010%), Immigrants from North America (84.2%, a difference of 0.020%), and Swiss (84.2%, a difference of 0.020%).
| Demographics | Rating | Rank | In Labor Force | Age 35-44 |
| Ecuadorians | 24.0 /100 | #198 | Fair 84.2% |
| Syrians | 23.2 /100 | #199 | Fair 84.2% |
| Moroccans | 23.2 /100 | #200 | Fair 84.2% |
| British | 23.0 /100 | #201 | Fair 84.2% |
| Immigrants | Uzbekistan | 22.8 /100 | #202 | Fair 84.2% |
| Immigrants | South Eastern Asia | 22.4 /100 | #203 | Fair 84.2% |
| Canadians | 19.9 /100 | #204 | Poor 84.2% |
| Immigrants | Canada | 19.6 /100 | #205 | Poor 84.2% |
| Immigrants | Costa Rica | 19.5 /100 | #206 | Poor 84.2% |
| Laotians | 19.0 /100 | #207 | Poor 84.2% |
| Immigrants | North America | 18.1 /100 | #208 | Poor 84.2% |
| Swiss | 17.4 /100 | #209 | Poor 84.2% |
| New Zealanders | 16.2 /100 | #210 | Poor 84.1% |
| Immigrants | Ecuador | 15.2 /100 | #211 | Poor 84.1% |
| Israelis | 14.0 /100 | #212 | Poor 84.1% |
Demographics Similar to Immigrants from Afghanistan by In Labor Force | Age 35-44
In terms of in labor force | age 35-44, the demographic groups most similar to Immigrants from Afghanistan are Irish (84.4%, a difference of 0.0%), Immigrants from Jordan (84.4%, a difference of 0.0%), Jordanian (84.4%, a difference of 0.010%), Scandinavian (84.4%, a difference of 0.010%), and Immigrants from Trinidad and Tobago (84.4%, a difference of 0.010%).
| Demographics | Rating | Rank | In Labor Force | Age 35-44 |
| Immigrants | Hungary | 59.4 /100 | #162 | Average 84.4% |
| Aleuts | 59.1 /100 | #163 | Average 84.4% |
| Nigerians | 58.9 /100 | #164 | Average 84.4% |
| Venezuelans | 58.1 /100 | #165 | Average 84.4% |
| Alsatians | 55.2 /100 | #166 | Average 84.4% |
| Immigrants | Portugal | 55.2 /100 | #167 | Average 84.4% |
| Irish | 53.1 /100 | #168 | Average 84.4% |
| Immigrants | Afghanistan | 52.7 /100 | #169 | Average 84.4% |
| Immigrants | Jordan | 52.5 /100 | #170 | Average 84.4% |
| Jordanians | 51.7 /100 | #171 | Average 84.4% |
| Scandinavians | 51.2 /100 | #172 | Average 84.4% |
| Immigrants | Trinidad and Tobago | 50.7 /100 | #173 | Average 84.4% |
| Immigrants | Iran | 50.0 /100 | #174 | Average 84.4% |
| Pakistanis | 48.2 /100 | #175 | Average 84.4% |
| Sri Lankans | 47.3 /100 | #176 | Average 84.4% |