Menominee vs Bulgarian Married-couple Households
COMPARE
Menominee
Bulgarian
Married-couple Households
Married-couple Households Comparison
Menominee
Bulgarians
42.0%
MARRIED-COUPLE HOUSEHOLDS
0.0/ 100
METRIC RATING
293rd/ 347
METRIC RANK
48.5%
MARRIED-COUPLE HOUSEHOLDS
99.1/ 100
METRIC RATING
61st/ 347
METRIC RANK
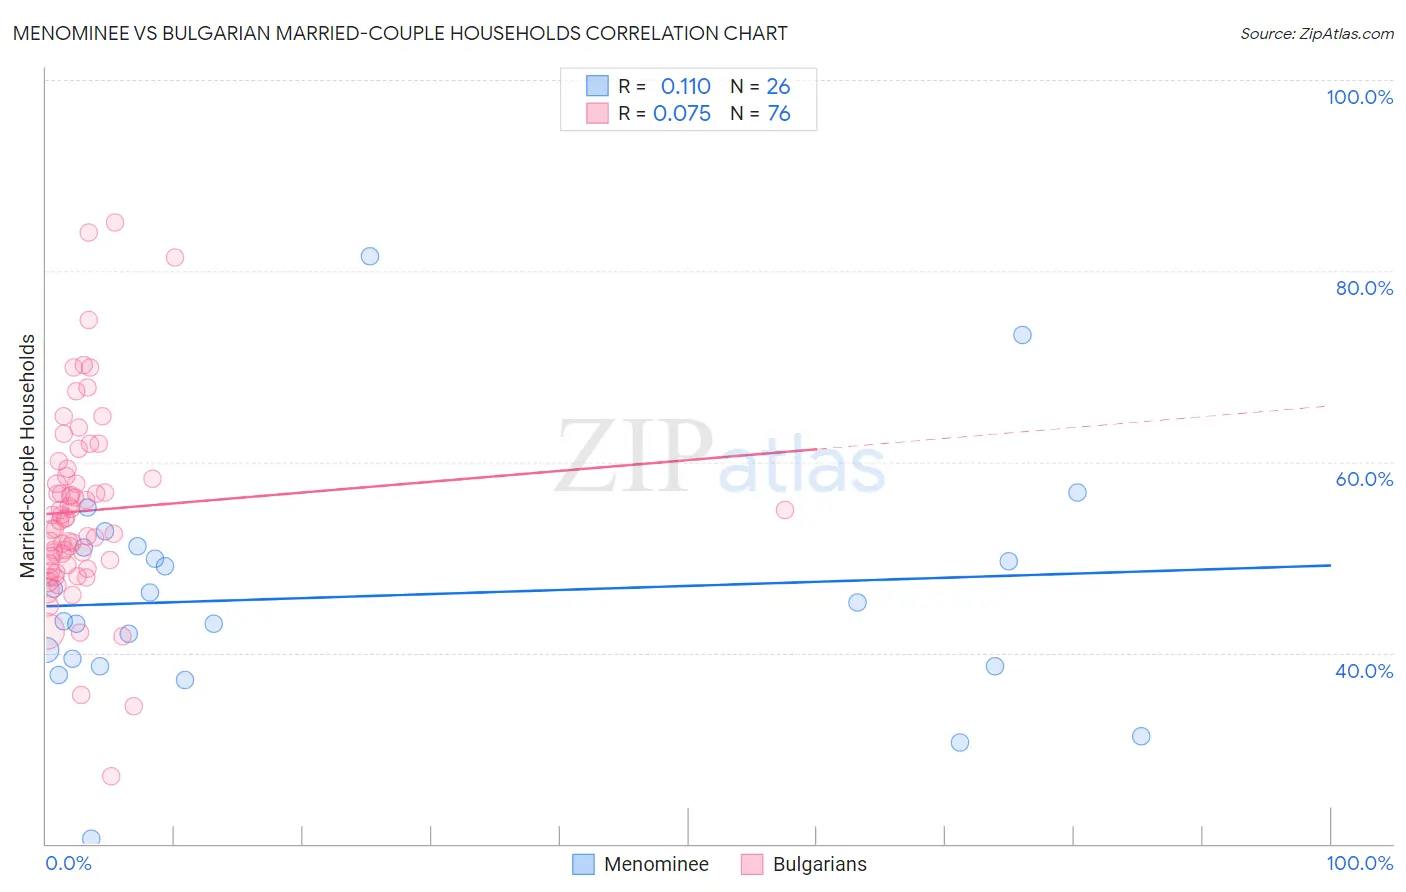
Menominee vs Bulgarian Married-couple Households Correlation Chart
The statistical analysis conducted on geographies consisting of 45,777,849 people shows a poor positive correlation between the proportion of Menominee and percentage of married-couple family households in the United States with a correlation coefficient (R) of 0.110 and weighted average of 42.0%. Similarly, the statistical analysis conducted on geographies consisting of 205,562,211 people shows a slight positive correlation between the proportion of Bulgarians and percentage of married-couple family households in the United States with a correlation coefficient (R) of 0.075 and weighted average of 48.5%, a difference of 15.5%.
Married-couple Households Correlation Summary
| Measurement | Menominee | Bulgarian |
| Minimum | 20.5% | 27.1% |
| Maximum | 81.5% | 85.1% |
| Range | 61.0% | 58.0% |
| Mean | 45.9% | 54.9% |
| Median | 44.3% | 53.9% |
| Interquartile 25% (IQ1) | 38.6% | 49.2% |
| Interquartile 75% (IQ3) | 51.0% | 58.4% |
| Interquartile Range (IQR) | 12.4% | 9.1% |
| Standard Deviation (Sample) | 12.4% | 10.0% |
| Standard Deviation (Population) | 12.1% | 9.9% |
Similar Demographics by Married-couple Households
Demographics Similar to Menominee by Married-couple Households
In terms of married-couple households, the demographic groups most similar to Menominee are Immigrants from Yemen (42.0%, a difference of 0.0%), Kiowa (42.0%, a difference of 0.0%), Indonesian (42.0%, a difference of 0.11%), Immigrants from Sudan (41.9%, a difference of 0.11%), and Paiute (42.1%, a difference of 0.16%).
| Demographics | Rating | Rank | Married-couple Households |
| Belizeans | 0.0 /100 | #286 | Tragic 42.2% |
| Chippewa | 0.0 /100 | #287 | Tragic 42.1% |
| Immigrants | Eritrea | 0.0 /100 | #288 | Tragic 42.1% |
| Sudanese | 0.0 /100 | #289 | Tragic 42.1% |
| Hondurans | 0.0 /100 | #290 | Tragic 42.1% |
| Paiute | 0.0 /100 | #291 | Tragic 42.1% |
| Indonesians | 0.0 /100 | #292 | Tragic 42.0% |
| Menominee | 0.0 /100 | #293 | Tragic 42.0% |
| Immigrants | Yemen | 0.0 /100 | #294 | Tragic 42.0% |
| Kiowa | 0.0 /100 | #295 | Tragic 42.0% |
| Immigrants | Sudan | 0.0 /100 | #296 | Tragic 41.9% |
| Arapaho | 0.0 /100 | #297 | Tragic 41.8% |
| Immigrants | Middle Africa | 0.0 /100 | #298 | Tragic 41.8% |
| Immigrants | Ghana | 0.0 /100 | #299 | Tragic 41.8% |
| Immigrants | Belize | 0.0 /100 | #300 | Tragic 41.8% |
Demographics Similar to Bulgarians by Married-couple Households
In terms of married-couple households, the demographic groups most similar to Bulgarians are Luxembourger (48.5%, a difference of 0.0%), Croatian (48.5%, a difference of 0.050%), Basque (48.4%, a difference of 0.070%), Northern European (48.4%, a difference of 0.080%), and Immigrants from Canada (48.4%, a difference of 0.10%).
| Demographics | Rating | Rank | Married-couple Households |
| Immigrants | Lithuania | 99.3 /100 | #54 | Exceptional 48.6% |
| Austrians | 99.3 /100 | #55 | Exceptional 48.6% |
| Immigrants | Northern Europe | 99.3 /100 | #56 | Exceptional 48.6% |
| Poles | 99.2 /100 | #57 | Exceptional 48.5% |
| Immigrants | Indonesia | 99.2 /100 | #58 | Exceptional 48.5% |
| Czechoslovakians | 99.2 /100 | #59 | Exceptional 48.5% |
| Croatians | 99.1 /100 | #60 | Exceptional 48.5% |
| Bulgarians | 99.1 /100 | #61 | Exceptional 48.5% |
| Luxembourgers | 99.1 /100 | #62 | Exceptional 48.5% |
| Basques | 99.0 /100 | #63 | Exceptional 48.4% |
| Northern Europeans | 99.0 /100 | #64 | Exceptional 48.4% |
| Immigrants | Canada | 99.0 /100 | #65 | Exceptional 48.4% |
| Jordanians | 98.9 /100 | #66 | Exceptional 48.4% |
| Romanians | 98.9 /100 | #67 | Exceptional 48.4% |
| Immigrants | South Eastern Asia | 98.9 /100 | #68 | Exceptional 48.4% |