Haitian vs Bulgarian In Labor Force | Age 35-44
COMPARE
Haitian
Bulgarian
In Labor Force | Age 35-44
In Labor Force | Age 35-44 Comparison
Haitians
Bulgarians
84.8%
IN LABOR FORCE | AGE 35-44
96.0/ 100
METRIC RATING
99th/ 347
METRIC RANK
85.5%
IN LABOR FORCE | AGE 35-44
100.0/ 100
METRIC RATING
21st/ 347
METRIC RANK
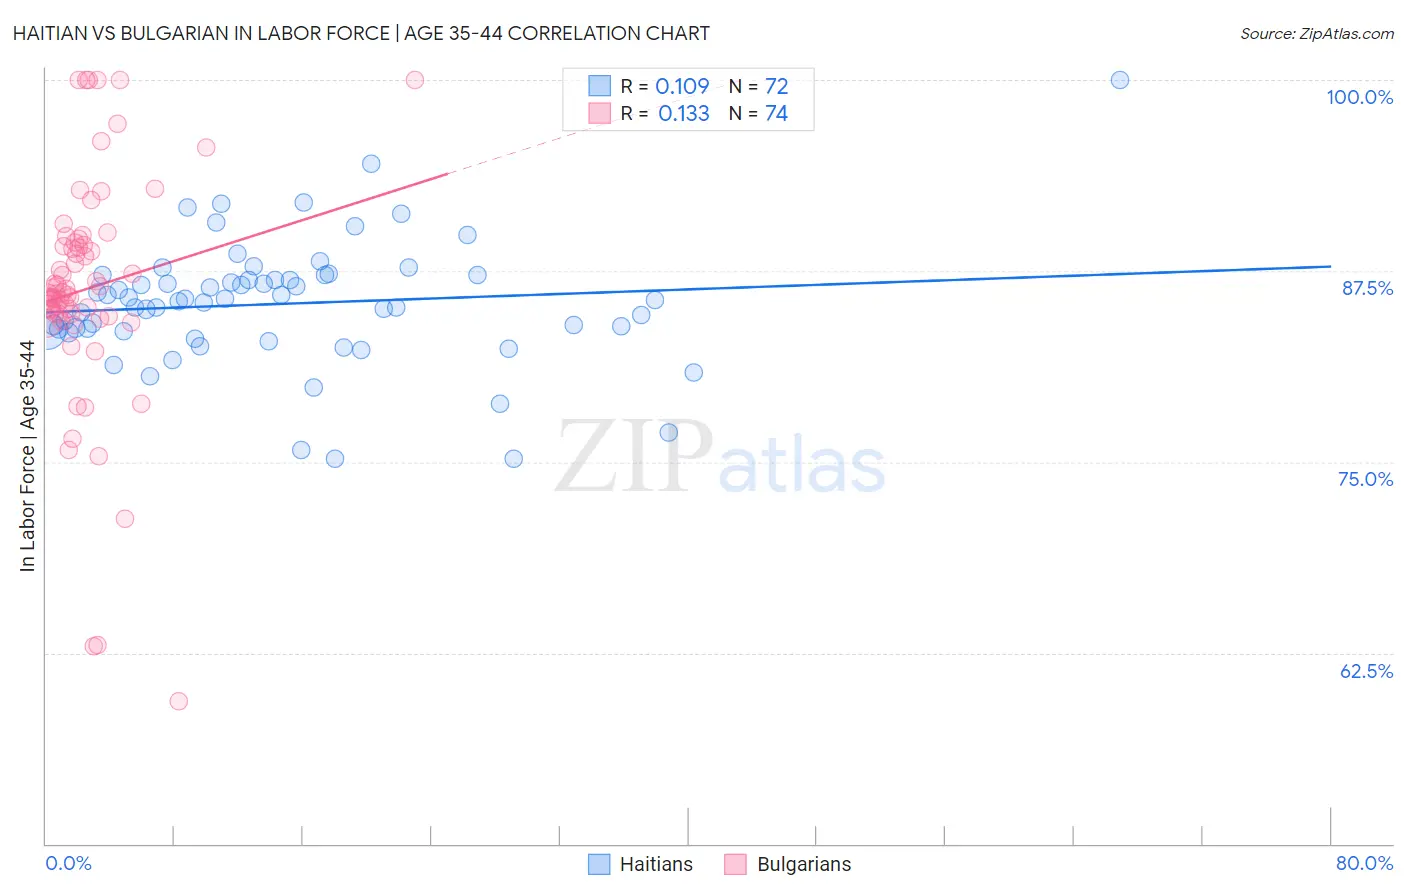
Haitian vs Bulgarian In Labor Force | Age 35-44 Correlation Chart
The statistical analysis conducted on geographies consisting of 287,765,256 people shows a poor positive correlation between the proportion of Haitians and labor force participation rate among population between the ages 35 and 44 in the United States with a correlation coefficient (R) of 0.109 and weighted average of 84.8%. Similarly, the statistical analysis conducted on geographies consisting of 205,570,158 people shows a poor positive correlation between the proportion of Bulgarians and labor force participation rate among population between the ages 35 and 44 in the United States with a correlation coefficient (R) of 0.133 and weighted average of 85.5%, a difference of 0.80%.
In Labor Force | Age 35-44 Correlation Summary
| Measurement | Haitian | Bulgarian |
| Minimum | 75.2% | 59.3% |
| Maximum | 100.0% | 100.0% |
| Range | 24.8% | 40.7% |
| Mean | 85.3% | 86.3% |
| Median | 85.5% | 86.0% |
| Interquartile 25% (IQ1) | 83.6% | 84.7% |
| Interquartile 75% (IQ3) | 87.1% | 89.4% |
| Interquartile Range (IQR) | 3.5% | 4.7% |
| Standard Deviation (Sample) | 4.1% | 7.7% |
| Standard Deviation (Population) | 4.1% | 7.7% |
Similar Demographics by In Labor Force | Age 35-44
Demographics Similar to Haitians by In Labor Force | Age 35-44
In terms of in labor force | age 35-44, the demographic groups most similar to Haitians are Indian (Asian) (84.8%, a difference of 0.0%), Immigrants from Czechoslovakia (84.8%, a difference of 0.0%), Immigrants from Australia (84.8%, a difference of 0.020%), Immigrants from Southern Europe (84.8%, a difference of 0.020%), and Immigrants from Kuwait (84.8%, a difference of 0.030%).
| Demographics | Rating | Rank | In Labor Force | Age 35-44 |
| Ghanaians | 97.2 /100 | #92 | Exceptional 84.8% |
| Immigrants | Northern Africa | 97.1 /100 | #93 | Exceptional 84.8% |
| Mongolians | 96.8 /100 | #94 | Exceptional 84.8% |
| Immigrants | Kuwait | 96.7 /100 | #95 | Exceptional 84.8% |
| Cubans | 96.6 /100 | #96 | Exceptional 84.8% |
| Egyptians | 96.6 /100 | #97 | Exceptional 84.8% |
| Indians (Asian) | 96.1 /100 | #98 | Exceptional 84.8% |
| Haitians | 96.0 /100 | #99 | Exceptional 84.8% |
| Immigrants | Czechoslovakia | 95.9 /100 | #100 | Exceptional 84.8% |
| Immigrants | Australia | 95.5 /100 | #101 | Exceptional 84.8% |
| Immigrants | Southern Europe | 95.3 /100 | #102 | Exceptional 84.8% |
| Immigrants | Belarus | 95.3 /100 | #103 | Exceptional 84.8% |
| Immigrants | Sweden | 95.2 /100 | #104 | Exceptional 84.8% |
| South Americans | 95.0 /100 | #105 | Exceptional 84.8% |
| Immigrants | Bahamas | 94.8 /100 | #106 | Exceptional 84.8% |
Demographics Similar to Bulgarians by In Labor Force | Age 35-44
In terms of in labor force | age 35-44, the demographic groups most similar to Bulgarians are Immigrants from Bosnia and Herzegovina (85.4%, a difference of 0.040%), Immigrants from Serbia (85.5%, a difference of 0.060%), Immigrants from Eastern Africa (85.4%, a difference of 0.060%), Carpatho Rusyn (85.6%, a difference of 0.10%), and Slovene (85.6%, a difference of 0.10%).
| Demographics | Rating | Rank | In Labor Force | Age 35-44 |
| Immigrants | Somalia | 100.0 /100 | #14 | Exceptional 85.6% |
| Norwegians | 100.0 /100 | #15 | Exceptional 85.6% |
| Immigrants | Ireland | 100.0 /100 | #16 | Exceptional 85.6% |
| Immigrants | North Macedonia | 100.0 /100 | #17 | Exceptional 85.6% |
| Carpatho Rusyns | 100.0 /100 | #18 | Exceptional 85.6% |
| Slovenes | 100.0 /100 | #19 | Exceptional 85.6% |
| Immigrants | Serbia | 100.0 /100 | #20 | Exceptional 85.5% |
| Bulgarians | 100.0 /100 | #21 | Exceptional 85.5% |
| Immigrants | Bosnia and Herzegovina | 100.0 /100 | #22 | Exceptional 85.4% |
| Immigrants | Eastern Africa | 100.0 /100 | #23 | Exceptional 85.4% |
| Latvians | 99.9 /100 | #24 | Exceptional 85.4% |
| Paraguayans | 99.9 /100 | #25 | Exceptional 85.4% |
| Immigrants | Liberia | 99.9 /100 | #26 | Exceptional 85.4% |
| Immigrants | Lithuania | 99.9 /100 | #27 | Exceptional 85.4% |
| Immigrants | Greece | 99.9 /100 | #28 | Exceptional 85.3% |