Immigrants from Nicaragua vs Bulgarian In Labor Force | Age 35-44
COMPARE
Immigrants from Nicaragua
Bulgarian
In Labor Force | Age 35-44
In Labor Force | Age 35-44 Comparison
Immigrants from Nicaragua
Bulgarians
84.1%
IN LABOR FORCE | AGE 35-44
9.4/ 100
METRIC RATING
218th/ 347
METRIC RANK
85.5%
IN LABOR FORCE | AGE 35-44
100.0/ 100
METRIC RATING
21st/ 347
METRIC RANK
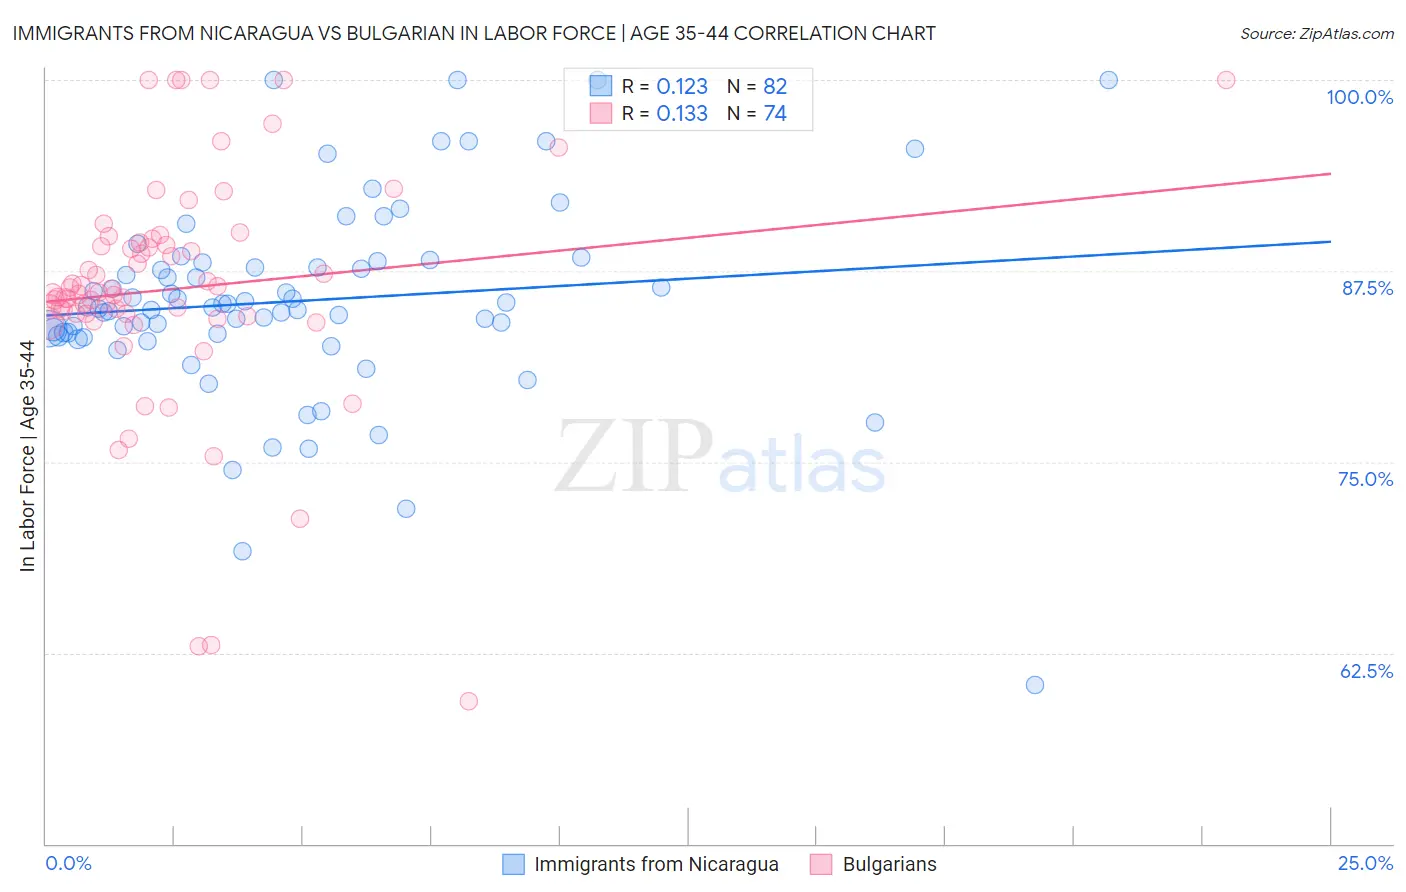
Immigrants from Nicaragua vs Bulgarian In Labor Force | Age 35-44 Correlation Chart
The statistical analysis conducted on geographies consisting of 236,329,760 people shows a poor positive correlation between the proportion of Immigrants from Nicaragua and labor force participation rate among population between the ages 35 and 44 in the United States with a correlation coefficient (R) of 0.123 and weighted average of 84.1%. Similarly, the statistical analysis conducted on geographies consisting of 205,570,158 people shows a poor positive correlation between the proportion of Bulgarians and labor force participation rate among population between the ages 35 and 44 in the United States with a correlation coefficient (R) of 0.133 and weighted average of 85.5%, a difference of 1.7%.
In Labor Force | Age 35-44 Correlation Summary
| Measurement | Immigrants from Nicaragua | Bulgarian |
| Minimum | 60.4% | 59.3% |
| Maximum | 100.0% | 100.0% |
| Range | 39.6% | 40.7% |
| Mean | 85.5% | 86.3% |
| Median | 85.1% | 86.0% |
| Interquartile 25% (IQ1) | 83.4% | 84.7% |
| Interquartile 75% (IQ3) | 88.1% | 89.4% |
| Interquartile Range (IQR) | 4.7% | 4.7% |
| Standard Deviation (Sample) | 6.6% | 7.7% |
| Standard Deviation (Population) | 6.5% | 7.7% |
Similar Demographics by In Labor Force | Age 35-44
Demographics Similar to Immigrants from Nicaragua by In Labor Force | Age 35-44
In terms of in labor force | age 35-44, the demographic groups most similar to Immigrants from Nicaragua are Subsaharan African (84.1%, a difference of 0.0%), Immigrants from Norway (84.1%, a difference of 0.040%), French (84.0%, a difference of 0.040%), European (84.1%, a difference of 0.050%), and Nicaraguan (84.1%, a difference of 0.050%).
| Demographics | Rating | Rank | In Labor Force | Age 35-44 |
| Immigrants | Ecuador | 15.2 /100 | #211 | Poor 84.1% |
| Israelis | 14.0 /100 | #212 | Poor 84.1% |
| Bangladeshis | 13.7 /100 | #213 | Poor 84.1% |
| Immigrants | Barbados | 13.2 /100 | #214 | Poor 84.1% |
| Europeans | 12.2 /100 | #215 | Poor 84.1% |
| Nicaraguans | 12.1 /100 | #216 | Poor 84.1% |
| Immigrants | Norway | 11.7 /100 | #217 | Poor 84.1% |
| Immigrants | Nicaragua | 9.4 /100 | #218 | Tragic 84.1% |
| Sub-Saharan Africans | 9.3 /100 | #219 | Tragic 84.1% |
| French | 7.5 /100 | #220 | Tragic 84.0% |
| Icelanders | 6.7 /100 | #221 | Tragic 84.0% |
| Assyrians/Chaldeans/Syriacs | 6.6 /100 | #222 | Tragic 84.0% |
| Immigrants | Panama | 6.4 /100 | #223 | Tragic 84.0% |
| U.S. Virgin Islanders | 6.1 /100 | #224 | Tragic 84.0% |
| Immigrants | Burma/Myanmar | 6.1 /100 | #225 | Tragic 84.0% |
Demographics Similar to Bulgarians by In Labor Force | Age 35-44
In terms of in labor force | age 35-44, the demographic groups most similar to Bulgarians are Immigrants from Bosnia and Herzegovina (85.4%, a difference of 0.040%), Immigrants from Serbia (85.5%, a difference of 0.060%), Immigrants from Eastern Africa (85.4%, a difference of 0.060%), Carpatho Rusyn (85.6%, a difference of 0.10%), and Slovene (85.6%, a difference of 0.10%).
| Demographics | Rating | Rank | In Labor Force | Age 35-44 |
| Immigrants | Somalia | 100.0 /100 | #14 | Exceptional 85.6% |
| Norwegians | 100.0 /100 | #15 | Exceptional 85.6% |
| Immigrants | Ireland | 100.0 /100 | #16 | Exceptional 85.6% |
| Immigrants | North Macedonia | 100.0 /100 | #17 | Exceptional 85.6% |
| Carpatho Rusyns | 100.0 /100 | #18 | Exceptional 85.6% |
| Slovenes | 100.0 /100 | #19 | Exceptional 85.6% |
| Immigrants | Serbia | 100.0 /100 | #20 | Exceptional 85.5% |
| Bulgarians | 100.0 /100 | #21 | Exceptional 85.5% |
| Immigrants | Bosnia and Herzegovina | 100.0 /100 | #22 | Exceptional 85.4% |
| Immigrants | Eastern Africa | 100.0 /100 | #23 | Exceptional 85.4% |
| Latvians | 99.9 /100 | #24 | Exceptional 85.4% |
| Paraguayans | 99.9 /100 | #25 | Exceptional 85.4% |
| Immigrants | Liberia | 99.9 /100 | #26 | Exceptional 85.4% |
| Immigrants | Lithuania | 99.9 /100 | #27 | Exceptional 85.4% |
| Immigrants | Greece | 99.9 /100 | #28 | Exceptional 85.3% |