Russian vs Immigrants from Uruguay In Labor Force | Age > 16
COMPARE
Russian
Immigrants from Uruguay
In Labor Force | Age > 16
In Labor Force | Age > 16 Comparison
Russians
Immigrants from Uruguay
64.9%
IN LABOR FORCE | AGE > 16
18.8/ 100
METRIC RATING
203rd/ 347
METRIC RANK
66.0%
IN LABOR FORCE | AGE > 16
99.1/ 100
METRIC RATING
95th/ 347
METRIC RANK
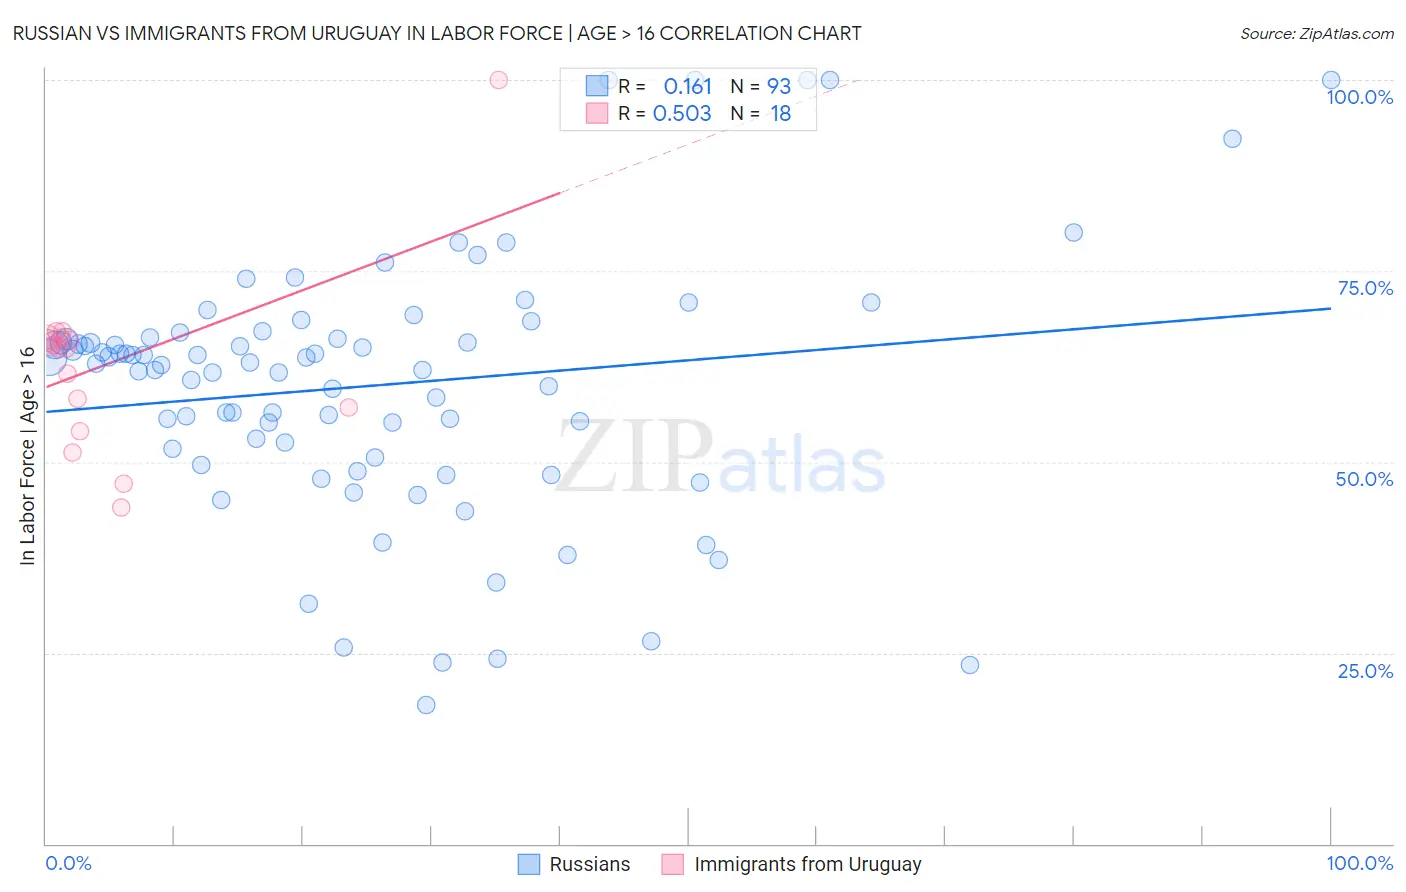
Russian vs Immigrants from Uruguay In Labor Force | Age > 16 Correlation Chart
The statistical analysis conducted on geographies consisting of 512,265,554 people shows a poor positive correlation between the proportion of Russians and labor force participation rate among population ages 16 and over in the United States with a correlation coefficient (R) of 0.161 and weighted average of 64.9%. Similarly, the statistical analysis conducted on geographies consisting of 133,256,636 people shows a substantial positive correlation between the proportion of Immigrants from Uruguay and labor force participation rate among population ages 16 and over in the United States with a correlation coefficient (R) of 0.503 and weighted average of 66.0%, a difference of 1.7%.
In Labor Force | Age > 16 Correlation Summary
| Measurement | Russian | Immigrants from Uruguay |
| Minimum | 18.2% | 44.0% |
| Maximum | 100.0% | 100.0% |
| Range | 81.8% | 56.0% |
| Mean | 60.0% | 62.9% |
| Median | 62.9% | 64.9% |
| Interquartile 25% (IQ1) | 51.1% | 57.1% |
| Interquartile 75% (IQ3) | 66.3% | 66.2% |
| Interquartile Range (IQR) | 15.2% | 9.1% |
| Standard Deviation (Sample) | 16.8% | 11.7% |
| Standard Deviation (Population) | 16.7% | 11.4% |
Similar Demographics by In Labor Force | Age > 16
Demographics Similar to Russians by In Labor Force | Age > 16
In terms of in labor force | age > 16, the demographic groups most similar to Russians are Slovene (64.9%, a difference of 0.0%), Jamaican (64.9%, a difference of 0.0%), Ukrainian (64.9%, a difference of 0.010%), Immigrants from Belgium (64.9%, a difference of 0.010%), and Armenian (64.9%, a difference of 0.030%).
| Demographics | Rating | Rank | In Labor Force | Age > 16 |
| Haitians | 30.6 /100 | #196 | Fair 65.0% |
| Immigrants | Italy | 28.7 /100 | #197 | Fair 65.0% |
| Greeks | 26.1 /100 | #198 | Fair 64.9% |
| Mexican American Indians | 23.1 /100 | #199 | Fair 64.9% |
| Armenians | 20.2 /100 | #200 | Fair 64.9% |
| Ukrainians | 19.6 /100 | #201 | Poor 64.9% |
| Immigrants | Belgium | 19.4 /100 | #202 | Poor 64.9% |
| Russians | 18.8 /100 | #203 | Poor 64.9% |
| Slovenes | 18.7 /100 | #204 | Poor 64.9% |
| Jamaicans | 18.7 /100 | #205 | Poor 64.9% |
| Lithuanians | 17.4 /100 | #206 | Poor 64.8% |
| Immigrants | Latin America | 16.4 /100 | #207 | Poor 64.8% |
| Belizeans | 16.2 /100 | #208 | Poor 64.8% |
| Immigrants | Trinidad and Tobago | 15.6 /100 | #209 | Poor 64.8% |
| Immigrants | Denmark | 14.7 /100 | #210 | Poor 64.8% |
Demographics Similar to Immigrants from Uruguay by In Labor Force | Age > 16
In terms of in labor force | age > 16, the demographic groups most similar to Immigrants from Uruguay are Immigrants from Cambodia (66.0%, a difference of 0.0%), Aleut (66.0%, a difference of 0.020%), Immigrants from South America (66.0%, a difference of 0.020%), Bangladeshi (65.9%, a difference of 0.040%), and Immigrants from Laos (66.0%, a difference of 0.050%).
| Demographics | Rating | Rank | In Labor Force | Age > 16 |
| Bermudans | 99.3 /100 | #88 | Exceptional 66.0% |
| Immigrants | Laos | 99.2 /100 | #89 | Exceptional 66.0% |
| Chileans | 99.2 /100 | #90 | Exceptional 66.0% |
| Iranians | 99.2 /100 | #91 | Exceptional 66.0% |
| Aleuts | 99.1 /100 | #92 | Exceptional 66.0% |
| Immigrants | South America | 99.1 /100 | #93 | Exceptional 66.0% |
| Immigrants | Cambodia | 99.1 /100 | #94 | Exceptional 66.0% |
| Immigrants | Uruguay | 99.1 /100 | #95 | Exceptional 66.0% |
| Bangladeshis | 98.9 /100 | #96 | Exceptional 65.9% |
| Filipinos | 98.9 /100 | #97 | Exceptional 65.9% |
| Immigrants | Chile | 98.7 /100 | #98 | Exceptional 65.9% |
| Immigrants | Australia | 98.7 /100 | #99 | Exceptional 65.9% |
| Okinawans | 98.7 /100 | #100 | Exceptional 65.9% |
| Immigrants | Colombia | 98.6 /100 | #101 | Exceptional 65.9% |
| Uruguayans | 98.6 /100 | #102 | Exceptional 65.9% |