Indian (Asian) vs Immigrants from Uruguay In Labor Force | Age > 16
COMPARE
Indian (Asian)
Immigrants from Uruguay
In Labor Force | Age > 16
In Labor Force | Age > 16 Comparison
Indians (Asian)
Immigrants from Uruguay
65.5%
IN LABOR FORCE | AGE > 16
89.5/ 100
METRIC RATING
142nd/ 347
METRIC RANK
66.0%
IN LABOR FORCE | AGE > 16
99.1/ 100
METRIC RATING
95th/ 347
METRIC RANK
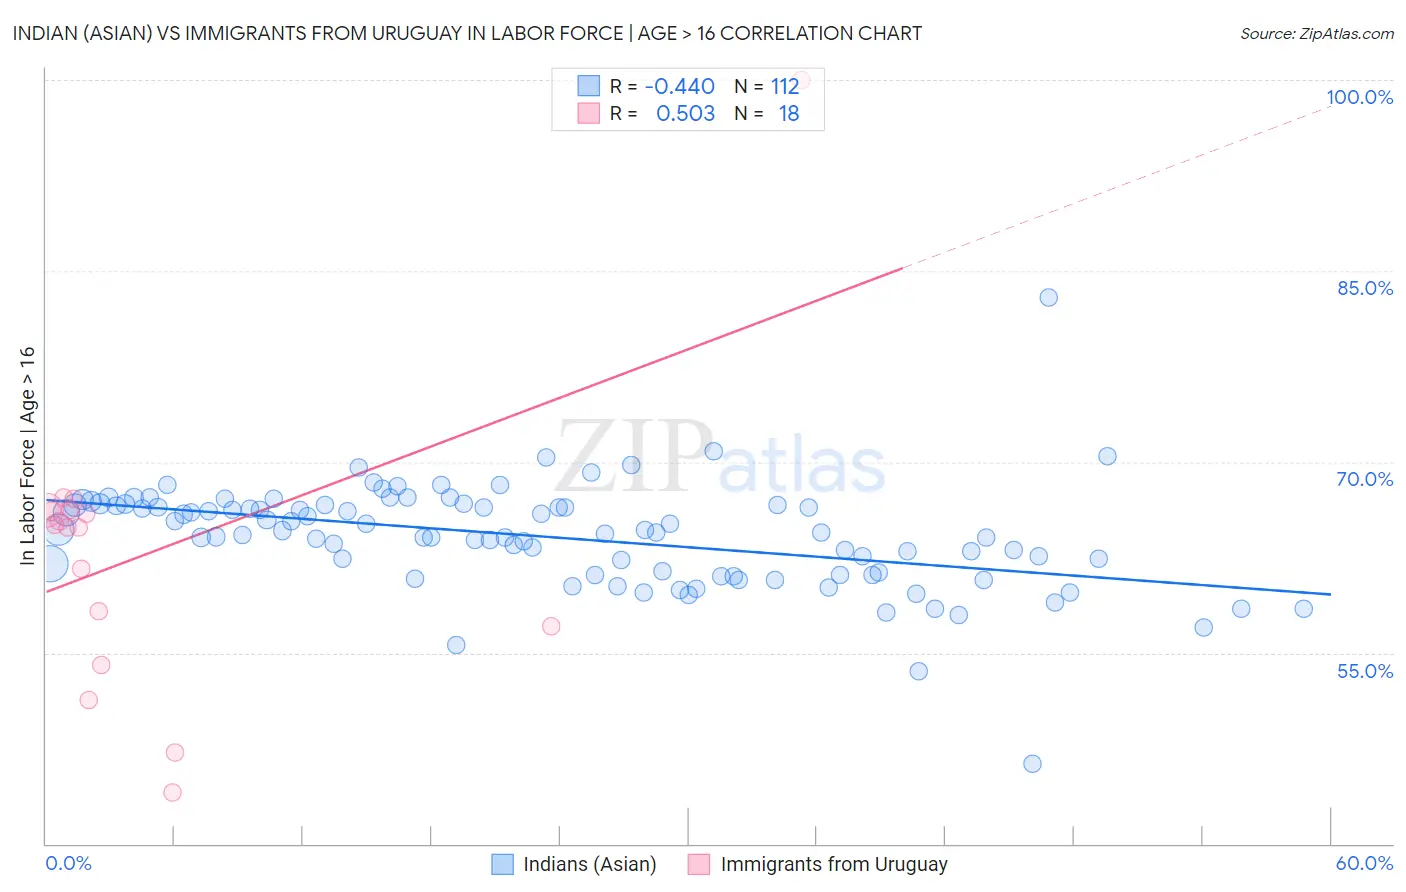
Indian (Asian) vs Immigrants from Uruguay In Labor Force | Age > 16 Correlation Chart
The statistical analysis conducted on geographies consisting of 495,373,057 people shows a moderate negative correlation between the proportion of Indians (Asian) and labor force participation rate among population ages 16 and over in the United States with a correlation coefficient (R) of -0.440 and weighted average of 65.5%. Similarly, the statistical analysis conducted on geographies consisting of 133,256,636 people shows a substantial positive correlation between the proportion of Immigrants from Uruguay and labor force participation rate among population ages 16 and over in the United States with a correlation coefficient (R) of 0.503 and weighted average of 66.0%, a difference of 0.70%.
In Labor Force | Age > 16 Correlation Summary
| Measurement | Indian (Asian) | Immigrants from Uruguay |
| Minimum | 46.3% | 44.0% |
| Maximum | 82.9% | 100.0% |
| Range | 36.6% | 56.0% |
| Mean | 64.1% | 62.9% |
| Median | 64.5% | 64.9% |
| Interquartile 25% (IQ1) | 61.3% | 57.1% |
| Interquartile 75% (IQ3) | 66.6% | 66.2% |
| Interquartile Range (IQR) | 5.4% | 9.1% |
| Standard Deviation (Sample) | 4.2% | 11.7% |
| Standard Deviation (Population) | 4.1% | 11.4% |
Similar Demographics by In Labor Force | Age > 16
Demographics Similar to Indians (Asian) by In Labor Force | Age > 16
In terms of in labor force | age > 16, the demographic groups most similar to Indians (Asian) are Latvian (65.5%, a difference of 0.0%), Immigrants from Romania (65.5%, a difference of 0.020%), Samoan (65.5%, a difference of 0.030%), Tlingit-Haida (65.5%, a difference of 0.030%), and Immigrants from Taiwan (65.5%, a difference of 0.040%).
| Demographics | Rating | Rank | In Labor Force | Age > 16 |
| Guatemalans | 92.5 /100 | #135 | Exceptional 65.6% |
| Immigrants | Argentina | 92.4 /100 | #136 | Exceptional 65.6% |
| Guamanians/Chamorros | 92.4 /100 | #137 | Exceptional 65.6% |
| Immigrants | West Indies | 92.0 /100 | #138 | Exceptional 65.6% |
| Immigrants | Taiwan | 90.8 /100 | #139 | Exceptional 65.5% |
| Immigrants | Costa Rica | 90.8 /100 | #140 | Exceptional 65.5% |
| Samoans | 90.5 /100 | #141 | Exceptional 65.5% |
| Indians (Asian) | 89.5 /100 | #142 | Excellent 65.5% |
| Latvians | 89.4 /100 | #143 | Excellent 65.5% |
| Immigrants | Romania | 88.6 /100 | #144 | Excellent 65.5% |
| Tlingit-Haida | 88.3 /100 | #145 | Excellent 65.5% |
| Cypriots | 88.2 /100 | #146 | Excellent 65.5% |
| Immigrants | Oceania | 87.5 /100 | #147 | Excellent 65.5% |
| Bhutanese | 86.3 /100 | #148 | Excellent 65.5% |
| Immigrants | Albania | 85.7 /100 | #149 | Excellent 65.4% |
Demographics Similar to Immigrants from Uruguay by In Labor Force | Age > 16
In terms of in labor force | age > 16, the demographic groups most similar to Immigrants from Uruguay are Immigrants from Cambodia (66.0%, a difference of 0.0%), Aleut (66.0%, a difference of 0.020%), Immigrants from South America (66.0%, a difference of 0.020%), Bangladeshi (65.9%, a difference of 0.040%), and Immigrants from Laos (66.0%, a difference of 0.050%).
| Demographics | Rating | Rank | In Labor Force | Age > 16 |
| Bermudans | 99.3 /100 | #88 | Exceptional 66.0% |
| Immigrants | Laos | 99.2 /100 | #89 | Exceptional 66.0% |
| Chileans | 99.2 /100 | #90 | Exceptional 66.0% |
| Iranians | 99.2 /100 | #91 | Exceptional 66.0% |
| Aleuts | 99.1 /100 | #92 | Exceptional 66.0% |
| Immigrants | South America | 99.1 /100 | #93 | Exceptional 66.0% |
| Immigrants | Cambodia | 99.1 /100 | #94 | Exceptional 66.0% |
| Immigrants | Uruguay | 99.1 /100 | #95 | Exceptional 66.0% |
| Bangladeshis | 98.9 /100 | #96 | Exceptional 65.9% |
| Filipinos | 98.9 /100 | #97 | Exceptional 65.9% |
| Immigrants | Chile | 98.7 /100 | #98 | Exceptional 65.9% |
| Immigrants | Australia | 98.7 /100 | #99 | Exceptional 65.9% |
| Okinawans | 98.7 /100 | #100 | Exceptional 65.9% |
| Immigrants | Colombia | 98.6 /100 | #101 | Exceptional 65.9% |
| Uruguayans | 98.6 /100 | #102 | Exceptional 65.9% |