Immigrants from Uganda vs Immigrants from Uruguay Child Poverty Under the Age of 5
COMPARE
Immigrants from Uganda
Immigrants from Uruguay
Child Poverty Under the Age of 5
Child Poverty Under the Age of 5 Comparison
Immigrants from Uganda
Immigrants from Uruguay
17.7%
CHILD POVERTY UNDER THE AGE OF 5
25.0/ 100
METRIC RATING
193rd/ 347
METRIC RANK
17.7%
CHILD POVERTY UNDER THE AGE OF 5
27.8/ 100
METRIC RATING
192nd/ 347
METRIC RANK
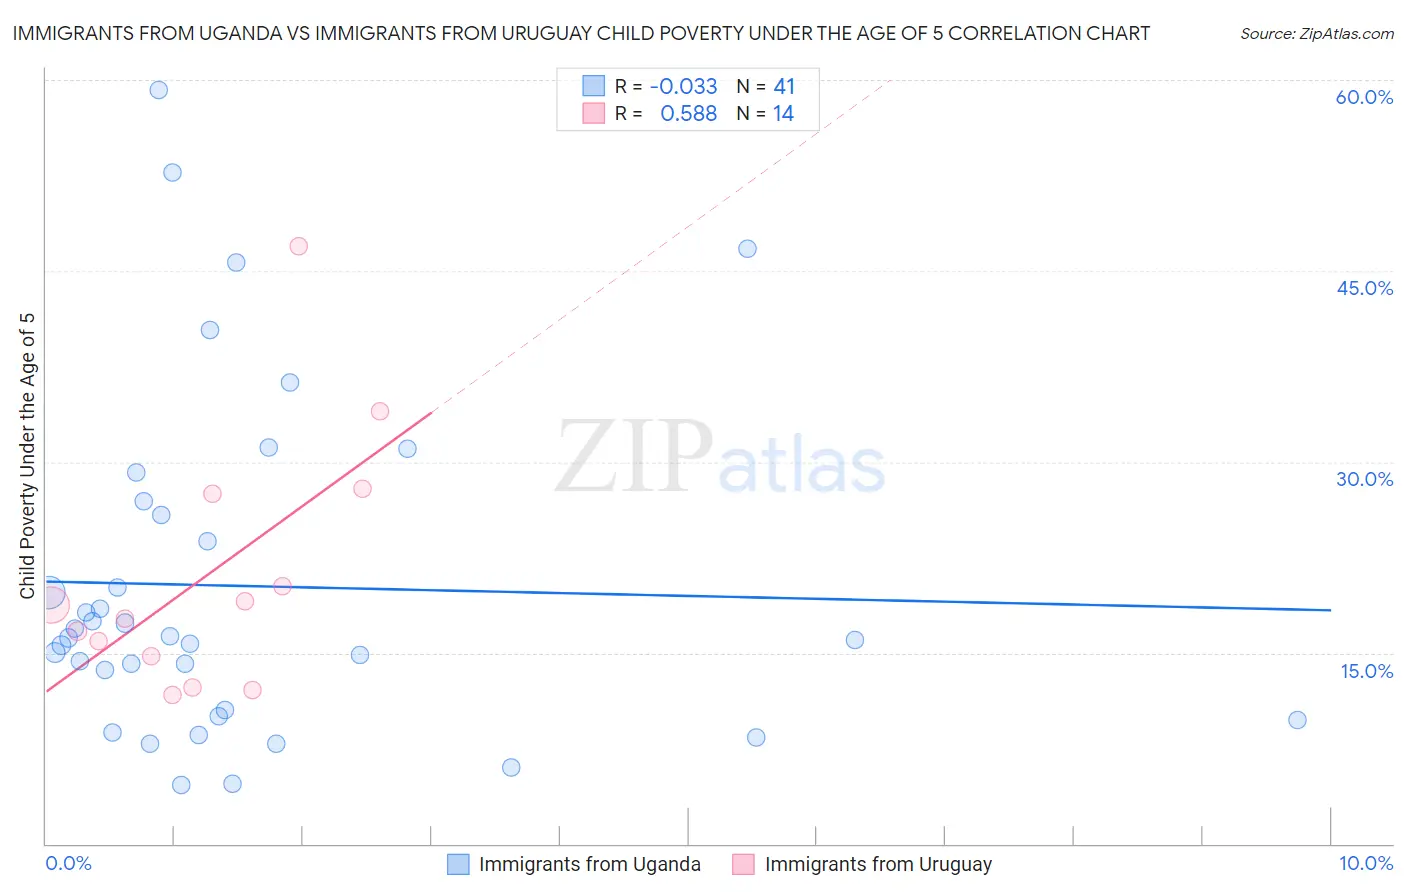
Immigrants from Uganda vs Immigrants from Uruguay Child Poverty Under the Age of 5 Correlation Chart
The statistical analysis conducted on geographies consisting of 124,022,230 people shows no correlation between the proportion of Immigrants from Uganda and poverty level among children under the age of 5 in the United States with a correlation coefficient (R) of -0.033 and weighted average of 17.7%. Similarly, the statistical analysis conducted on geographies consisting of 130,958,441 people shows a substantial positive correlation between the proportion of Immigrants from Uruguay and poverty level among children under the age of 5 in the United States with a correlation coefficient (R) of 0.588 and weighted average of 17.7%, a difference of 0.37%.
Child Poverty Under the Age of 5 Correlation Summary
| Measurement | Immigrants from Uganda | Immigrants from Uruguay |
| Minimum | 4.6% | 11.7% |
| Maximum | 59.2% | 46.9% |
| Range | 54.6% | 35.2% |
| Mean | 20.2% | 21.1% |
| Median | 16.2% | 18.2% |
| Interquartile 25% (IQ1) | 10.2% | 14.7% |
| Interquartile 75% (IQ3) | 26.4% | 27.5% |
| Interquartile Range (IQR) | 16.1% | 12.8% |
| Standard Deviation (Sample) | 13.3% | 9.9% |
| Standard Deviation (Population) | 13.1% | 9.5% |
Demographics Similar to Immigrants from Uganda and Immigrants from Uruguay by Child Poverty Under the Age of 5
In terms of child poverty under the age of 5, the demographic groups most similar to Immigrants from Uganda are French Canadian (17.7%, a difference of 0.060%), Sierra Leonean (17.7%, a difference of 0.12%), Immigrants from Afghanistan (17.7%, a difference of 0.37%), Immigrants from Portugal (17.8%, a difference of 0.39%), and Slovak (17.6%, a difference of 0.54%). Similarly, the demographic groups most similar to Immigrants from Uruguay are Immigrants from Afghanistan (17.7%, a difference of 0.0%), Slovak (17.6%, a difference of 0.17%), French Canadian (17.7%, a difference of 0.43%), Sierra Leonean (17.7%, a difference of 0.49%), and French (17.5%, a difference of 0.69%).
| Demographics | Rating | Rank | Child Poverty Under the Age of 5 |
| Arabs | 40.7 /100 | #182 | Average 17.4% |
| Lebanese | 40.3 /100 | #183 | Average 17.4% |
| Immigrants | Costa Rica | 39.0 /100 | #184 | Fair 17.4% |
| Immigrants | Armenia | 38.0 /100 | #185 | Fair 17.5% |
| Immigrants | Bosnia and Herzegovina | 35.0 /100 | #186 | Fair 17.5% |
| Kenyans | 34.7 /100 | #187 | Fair 17.5% |
| Carpatho Rusyns | 33.6 /100 | #188 | Fair 17.5% |
| French | 33.6 /100 | #189 | Fair 17.5% |
| Slovaks | 29.2 /100 | #190 | Fair 17.6% |
| Immigrants | Afghanistan | 27.9 /100 | #191 | Fair 17.7% |
| Immigrants | Uruguay | 27.8 /100 | #192 | Fair 17.7% |
| Immigrants | Uganda | 25.0 /100 | #193 | Fair 17.7% |
| French Canadians | 24.6 /100 | #194 | Fair 17.7% |
| Sierra Leoneans | 24.1 /100 | #195 | Fair 17.7% |
| Immigrants | Portugal | 22.2 /100 | #196 | Fair 17.8% |
| Immigrants | Kenya | 20.0 /100 | #197 | Fair 17.9% |
| Celtics | 18.3 /100 | #198 | Poor 17.9% |
| Hungarians | 18.3 /100 | #199 | Poor 17.9% |
| Iraqis | 14.0 /100 | #200 | Poor 18.0% |
| Ugandans | 13.9 /100 | #201 | Poor 18.0% |
| Japanese | 13.8 /100 | #202 | Poor 18.1% |