Pennsylvania German vs Immigrants from Uruguay In Labor Force | Age > 16
COMPARE
Pennsylvania German
Immigrants from Uruguay
In Labor Force | Age > 16
In Labor Force | Age > 16 Comparison
Pennsylvania Germans
Immigrants from Uruguay
63.4%
IN LABOR FORCE | AGE > 16
0.0/ 100
METRIC RATING
308th/ 347
METRIC RANK
66.0%
IN LABOR FORCE | AGE > 16
99.1/ 100
METRIC RATING
95th/ 347
METRIC RANK
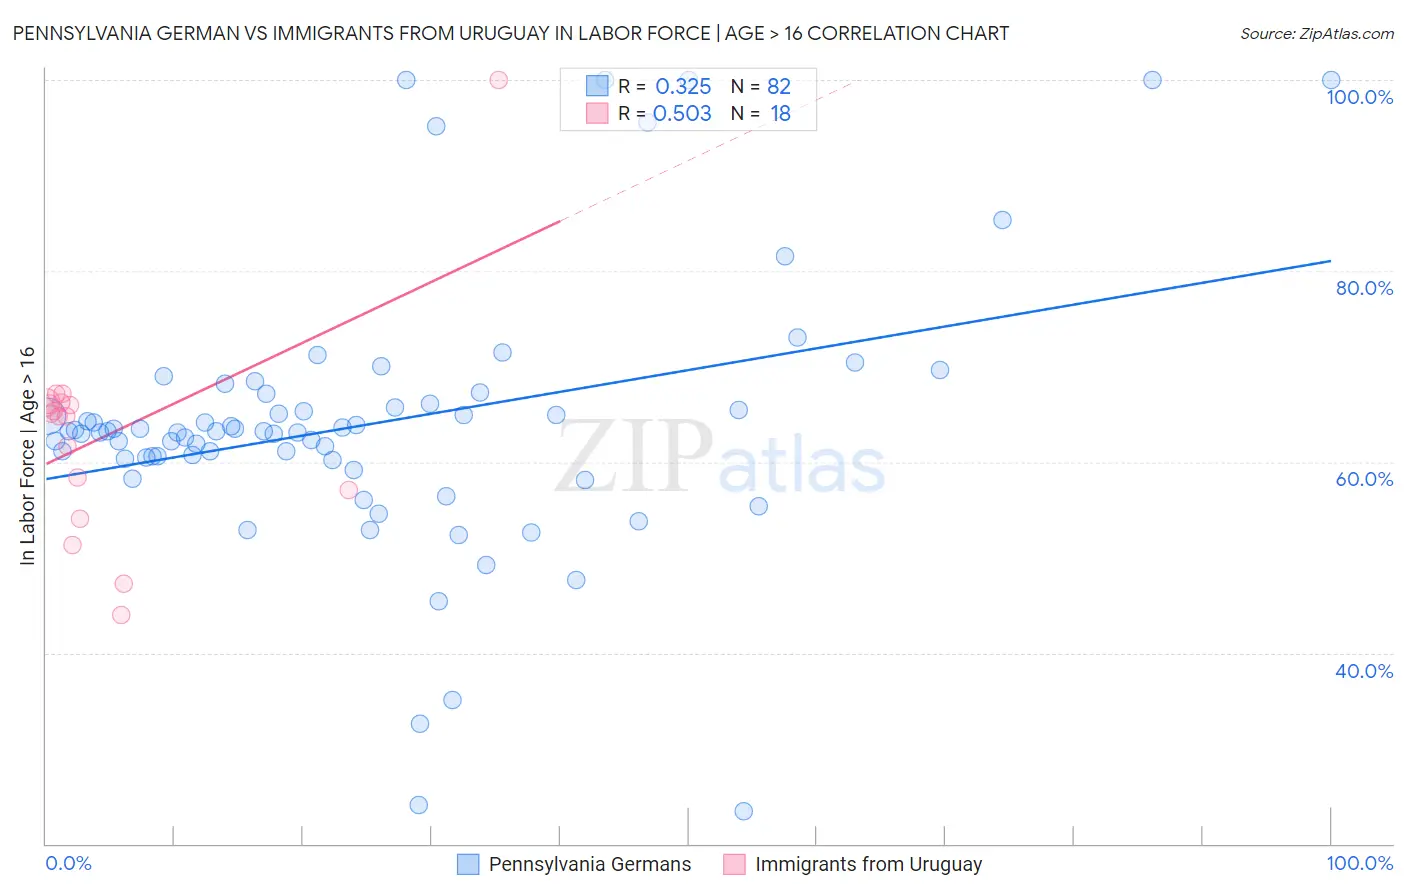
Pennsylvania German vs Immigrants from Uruguay In Labor Force | Age > 16 Correlation Chart
The statistical analysis conducted on geographies consisting of 234,107,646 people shows a mild positive correlation between the proportion of Pennsylvania Germans and labor force participation rate among population ages 16 and over in the United States with a correlation coefficient (R) of 0.325 and weighted average of 63.4%. Similarly, the statistical analysis conducted on geographies consisting of 133,256,636 people shows a substantial positive correlation between the proportion of Immigrants from Uruguay and labor force participation rate among population ages 16 and over in the United States with a correlation coefficient (R) of 0.503 and weighted average of 66.0%, a difference of 4.1%.
In Labor Force | Age > 16 Correlation Summary
| Measurement | Pennsylvania German | Immigrants from Uruguay |
| Minimum | 23.4% | 44.0% |
| Maximum | 100.0% | 100.0% |
| Range | 76.6% | 56.0% |
| Mean | 64.0% | 62.9% |
| Median | 63.2% | 64.9% |
| Interquartile 25% (IQ1) | 60.3% | 57.1% |
| Interquartile 75% (IQ3) | 66.1% | 66.2% |
| Interquartile Range (IQR) | 5.8% | 9.1% |
| Standard Deviation (Sample) | 14.3% | 11.7% |
| Standard Deviation (Population) | 14.2% | 11.4% |
Similar Demographics by In Labor Force | Age > 16
Demographics Similar to Pennsylvania Germans by In Labor Force | Age > 16
In terms of in labor force | age > 16, the demographic groups most similar to Pennsylvania Germans are Central American Indian (63.4%, a difference of 0.050%), Black/African American (63.4%, a difference of 0.080%), Scotch-Irish (63.3%, a difference of 0.13%), Osage (63.5%, a difference of 0.18%), and Shoshone (63.2%, a difference of 0.20%).
| Demographics | Rating | Rank | In Labor Force | Age > 16 |
| Spanish Americans | 0.0 /100 | #301 | Tragic 63.6% |
| Delaware | 0.0 /100 | #302 | Tragic 63.6% |
| Cree | 0.0 /100 | #303 | Tragic 63.5% |
| Immigrants | Nonimmigrants | 0.0 /100 | #304 | Tragic 63.5% |
| Osage | 0.0 /100 | #305 | Tragic 63.5% |
| Blacks/African Americans | 0.0 /100 | #306 | Tragic 63.4% |
| Central American Indians | 0.0 /100 | #307 | Tragic 63.4% |
| Pennsylvania Germans | 0.0 /100 | #308 | Tragic 63.4% |
| Scotch-Irish | 0.0 /100 | #309 | Tragic 63.3% |
| Shoshone | 0.0 /100 | #310 | Tragic 63.2% |
| Blackfeet | 0.0 /100 | #311 | Tragic 63.2% |
| Iroquois | 0.0 /100 | #312 | Tragic 63.2% |
| Chippewa | 0.0 /100 | #313 | Tragic 63.1% |
| Yaqui | 0.0 /100 | #314 | Tragic 63.0% |
| Potawatomi | 0.0 /100 | #315 | Tragic 62.8% |
Demographics Similar to Immigrants from Uruguay by In Labor Force | Age > 16
In terms of in labor force | age > 16, the demographic groups most similar to Immigrants from Uruguay are Immigrants from Cambodia (66.0%, a difference of 0.0%), Aleut (66.0%, a difference of 0.020%), Immigrants from South America (66.0%, a difference of 0.020%), Bangladeshi (65.9%, a difference of 0.040%), and Immigrants from Laos (66.0%, a difference of 0.050%).
| Demographics | Rating | Rank | In Labor Force | Age > 16 |
| Bermudans | 99.3 /100 | #88 | Exceptional 66.0% |
| Immigrants | Laos | 99.2 /100 | #89 | Exceptional 66.0% |
| Chileans | 99.2 /100 | #90 | Exceptional 66.0% |
| Iranians | 99.2 /100 | #91 | Exceptional 66.0% |
| Aleuts | 99.1 /100 | #92 | Exceptional 66.0% |
| Immigrants | South America | 99.1 /100 | #93 | Exceptional 66.0% |
| Immigrants | Cambodia | 99.1 /100 | #94 | Exceptional 66.0% |
| Immigrants | Uruguay | 99.1 /100 | #95 | Exceptional 66.0% |
| Bangladeshis | 98.9 /100 | #96 | Exceptional 65.9% |
| Filipinos | 98.9 /100 | #97 | Exceptional 65.9% |
| Immigrants | Chile | 98.7 /100 | #98 | Exceptional 65.9% |
| Immigrants | Australia | 98.7 /100 | #99 | Exceptional 65.9% |
| Okinawans | 98.7 /100 | #100 | Exceptional 65.9% |
| Immigrants | Colombia | 98.6 /100 | #101 | Exceptional 65.9% |
| Uruguayans | 98.6 /100 | #102 | Exceptional 65.9% |