Immigrants from Poland vs Immigrants from Uruguay In Labor Force | Age > 16
COMPARE
Immigrants from Poland
Immigrants from Uruguay
In Labor Force | Age > 16
In Labor Force | Age > 16 Comparison
Immigrants from Poland
Immigrants from Uruguay
65.8%
IN LABOR FORCE | AGE > 16
98.1/ 100
METRIC RATING
107th/ 347
METRIC RANK
66.0%
IN LABOR FORCE | AGE > 16
99.1/ 100
METRIC RATING
95th/ 347
METRIC RANK
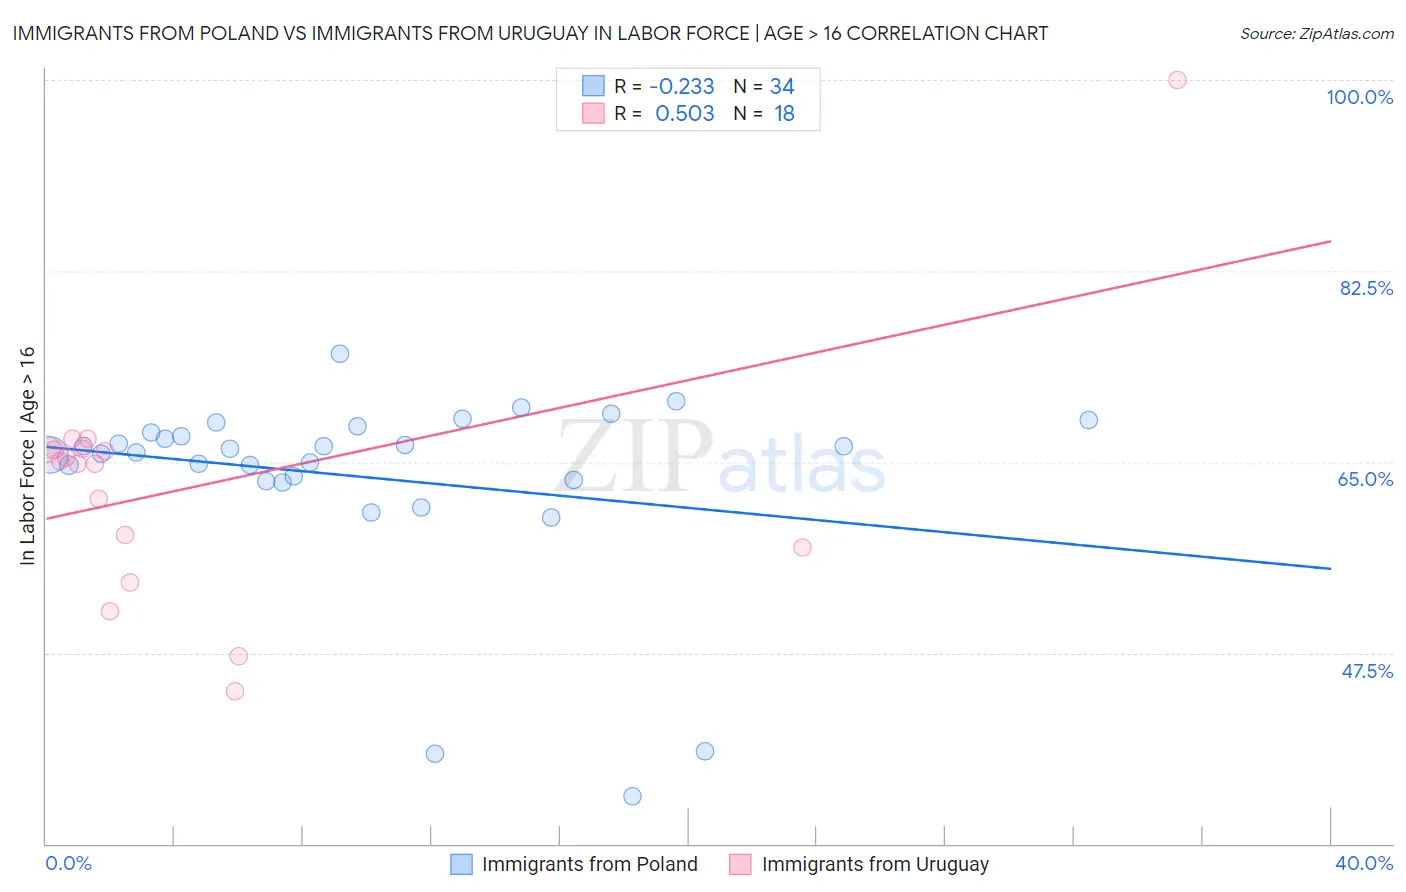
Immigrants from Poland vs Immigrants from Uruguay In Labor Force | Age > 16 Correlation Chart
The statistical analysis conducted on geographies consisting of 304,860,925 people shows a weak negative correlation between the proportion of Immigrants from Poland and labor force participation rate among population ages 16 and over in the United States with a correlation coefficient (R) of -0.233 and weighted average of 65.8%. Similarly, the statistical analysis conducted on geographies consisting of 133,256,636 people shows a substantial positive correlation between the proportion of Immigrants from Uruguay and labor force participation rate among population ages 16 and over in the United States with a correlation coefficient (R) of 0.503 and weighted average of 66.0%, a difference of 0.19%.
In Labor Force | Age > 16 Correlation Summary
| Measurement | Immigrants from Poland | Immigrants from Uruguay |
| Minimum | 34.3% | 44.0% |
| Maximum | 74.9% | 100.0% |
| Range | 40.6% | 56.0% |
| Mean | 63.6% | 62.9% |
| Median | 66.1% | 64.9% |
| Interquartile 25% (IQ1) | 63.3% | 57.1% |
| Interquartile 75% (IQ3) | 67.7% | 66.2% |
| Interquartile Range (IQR) | 4.4% | 9.1% |
| Standard Deviation (Sample) | 8.9% | 11.7% |
| Standard Deviation (Population) | 8.8% | 11.4% |
Demographics Similar to Immigrants from Poland and Immigrants from Uruguay by In Labor Force | Age > 16
In terms of in labor force | age > 16, the demographic groups most similar to Immigrants from Poland are Immigrants from Serbia (65.8%, a difference of 0.0%), Immigrants from Spain (65.8%, a difference of 0.010%), Immigrants from Japan (65.8%, a difference of 0.020%), Colombian (65.9%, a difference of 0.040%), and Palestinian (65.9%, a difference of 0.050%). Similarly, the demographic groups most similar to Immigrants from Uruguay are Immigrants from Cambodia (66.0%, a difference of 0.0%), Aleut (66.0%, a difference of 0.020%), Immigrants from South America (66.0%, a difference of 0.020%), Bangladeshi (65.9%, a difference of 0.040%), and Iranian (66.0%, a difference of 0.050%).
| Demographics | Rating | Rank | In Labor Force | Age > 16 |
| Iranians | 99.2 /100 | #91 | Exceptional 66.0% |
| Aleuts | 99.1 /100 | #92 | Exceptional 66.0% |
| Immigrants | South America | 99.1 /100 | #93 | Exceptional 66.0% |
| Immigrants | Cambodia | 99.1 /100 | #94 | Exceptional 66.0% |
| Immigrants | Uruguay | 99.1 /100 | #95 | Exceptional 66.0% |
| Bangladeshis | 98.9 /100 | #96 | Exceptional 65.9% |
| Filipinos | 98.9 /100 | #97 | Exceptional 65.9% |
| Immigrants | Chile | 98.7 /100 | #98 | Exceptional 65.9% |
| Immigrants | Australia | 98.7 /100 | #99 | Exceptional 65.9% |
| Okinawans | 98.7 /100 | #100 | Exceptional 65.9% |
| Immigrants | Colombia | 98.6 /100 | #101 | Exceptional 65.9% |
| Uruguayans | 98.6 /100 | #102 | Exceptional 65.9% |
| Immigrants | South Eastern Asia | 98.5 /100 | #103 | Exceptional 65.9% |
| Palestinians | 98.5 /100 | #104 | Exceptional 65.9% |
| Colombians | 98.4 /100 | #105 | Exceptional 65.9% |
| Immigrants | Serbia | 98.1 /100 | #106 | Exceptional 65.8% |
| Immigrants | Poland | 98.1 /100 | #107 | Exceptional 65.8% |
| Immigrants | Spain | 98.0 /100 | #108 | Exceptional 65.8% |
| Immigrants | Japan | 98.0 /100 | #109 | Exceptional 65.8% |
| Japanese | 97.7 /100 | #110 | Exceptional 65.8% |
| Immigrants | Honduras | 97.5 /100 | #111 | Exceptional 65.8% |