Immigrants from Russia vs Immigrants from Mexico In Labor Force | Age > 16
COMPARE
Immigrants from Russia
Immigrants from Mexico
In Labor Force | Age > 16
In Labor Force | Age > 16 Comparison
Immigrants from Russia
Immigrants from Mexico
65.3%
IN LABOR FORCE | AGE > 16
75.7/ 100
METRIC RATING
157th/ 347
METRIC RANK
64.3%
IN LABOR FORCE | AGE > 16
1.0/ 100
METRIC RATING
256th/ 347
METRIC RANK
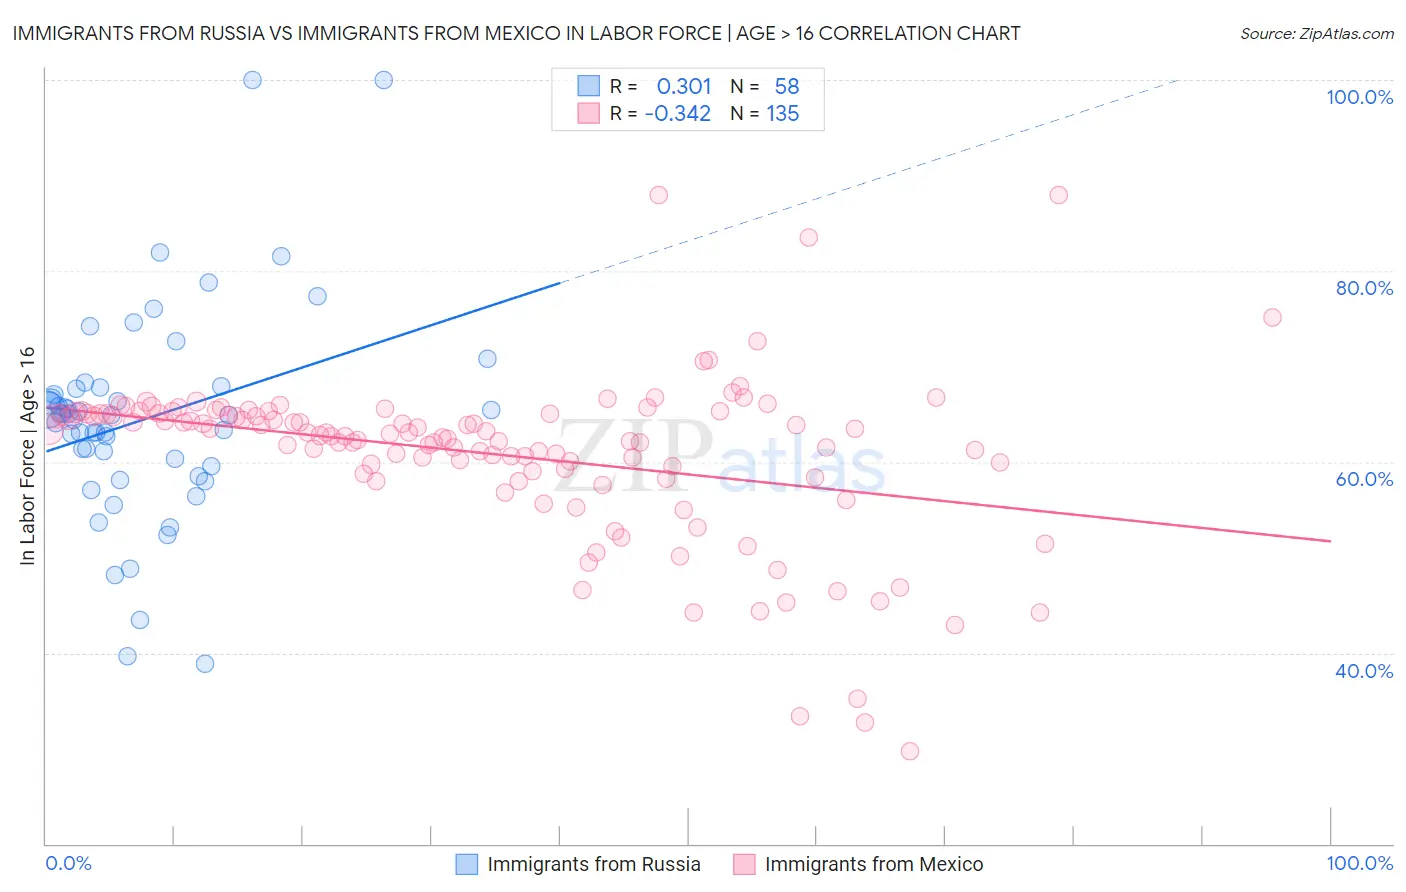
Immigrants from Russia vs Immigrants from Mexico In Labor Force | Age > 16 Correlation Chart
The statistical analysis conducted on geographies consisting of 347,958,587 people shows a mild positive correlation between the proportion of Immigrants from Russia and labor force participation rate among population ages 16 and over in the United States with a correlation coefficient (R) of 0.301 and weighted average of 65.3%. Similarly, the statistical analysis conducted on geographies consisting of 513,718,748 people shows a mild negative correlation between the proportion of Immigrants from Mexico and labor force participation rate among population ages 16 and over in the United States with a correlation coefficient (R) of -0.342 and weighted average of 64.3%, a difference of 1.6%.
In Labor Force | Age > 16 Correlation Summary
| Measurement | Immigrants from Russia | Immigrants from Mexico |
| Minimum | 38.9% | 29.7% |
| Maximum | 100.0% | 88.0% |
| Range | 61.1% | 58.3% |
| Mean | 64.5% | 60.8% |
| Median | 64.9% | 62.9% |
| Interquartile 25% (IQ1) | 59.6% | 59.0% |
| Interquartile 75% (IQ3) | 67.7% | 65.1% |
| Interquartile Range (IQR) | 8.1% | 6.1% |
| Standard Deviation (Sample) | 11.1% | 8.7% |
| Standard Deviation (Population) | 11.0% | 8.7% |
Similar Demographics by In Labor Force | Age > 16
Demographics Similar to Immigrants from Russia by In Labor Force | Age > 16
In terms of in labor force | age > 16, the demographic groups most similar to Immigrants from Russia are Immigrants from Ireland (65.3%, a difference of 0.0%), Immigrants from Armenia (65.3%, a difference of 0.010%), Panamanian (65.3%, a difference of 0.010%), Immigrants from Syria (65.3%, a difference of 0.020%), and Immigrants from South Africa (65.3%, a difference of 0.030%).
| Demographics | Rating | Rank | In Labor Force | Age > 16 |
| Immigrants | Immigrants | 81.9 /100 | #150 | Excellent 65.4% |
| Czechs | 81.5 /100 | #151 | Excellent 65.4% |
| Yugoslavians | 81.3 /100 | #152 | Excellent 65.4% |
| Immigrants | China | 80.5 /100 | #153 | Excellent 65.4% |
| Immigrants | Eastern Europe | 78.3 /100 | #154 | Good 65.4% |
| Immigrants | Armenia | 76.6 /100 | #155 | Good 65.3% |
| Immigrants | Ireland | 75.9 /100 | #156 | Good 65.3% |
| Immigrants | Russia | 75.7 /100 | #157 | Good 65.3% |
| Panamanians | 75.2 /100 | #158 | Good 65.3% |
| Immigrants | Syria | 74.6 /100 | #159 | Good 65.3% |
| Immigrants | South Africa | 73.5 /100 | #160 | Good 65.3% |
| Australians | 71.3 /100 | #161 | Good 65.3% |
| Albanians | 70.8 /100 | #162 | Good 65.3% |
| South Africans | 69.8 /100 | #163 | Good 65.3% |
| Danes | 68.8 /100 | #164 | Good 65.3% |
Demographics Similar to Immigrants from Mexico by In Labor Force | Age > 16
In terms of in labor force | age > 16, the demographic groups most similar to Immigrants from Mexico are Hispanic or Latino (64.3%, a difference of 0.040%), Inupiat (64.3%, a difference of 0.040%), Immigrants from Scotland (64.2%, a difference of 0.060%), Immigrants from Western Europe (64.2%, a difference of 0.090%), and Marshallese (64.2%, a difference of 0.090%).
| Demographics | Rating | Rank | In Labor Force | Age > 16 |
| Germans | 1.8 /100 | #249 | Tragic 64.4% |
| British West Indians | 1.8 /100 | #250 | Tragic 64.4% |
| Portuguese | 1.6 /100 | #251 | Tragic 64.4% |
| Immigrants | Dominican Republic | 1.5 /100 | #252 | Tragic 64.4% |
| Czechoslovakians | 1.4 /100 | #253 | Tragic 64.3% |
| Immigrants | Uzbekistan | 1.4 /100 | #254 | Tragic 64.3% |
| Hispanics or Latinos | 1.1 /100 | #255 | Tragic 64.3% |
| Immigrants | Mexico | 1.0 /100 | #256 | Tragic 64.3% |
| Inupiat | 0.8 /100 | #257 | Tragic 64.3% |
| Immigrants | Scotland | 0.8 /100 | #258 | Tragic 64.2% |
| Immigrants | Western Europe | 0.7 /100 | #259 | Tragic 64.2% |
| Marshallese | 0.7 /100 | #260 | Tragic 64.2% |
| Basques | 0.7 /100 | #261 | Tragic 64.2% |
| Finns | 0.7 /100 | #262 | Tragic 64.2% |
| Bahamians | 0.6 /100 | #263 | Tragic 64.2% |