Immigrants from Russia vs Scotch-Irish In Labor Force | Age > 16
COMPARE
Immigrants from Russia
Scotch-Irish
In Labor Force | Age > 16
In Labor Force | Age > 16 Comparison
Immigrants from Russia
Scotch-Irish
65.3%
IN LABOR FORCE | AGE > 16
75.7/ 100
METRIC RATING
157th/ 347
METRIC RANK
63.3%
IN LABOR FORCE | AGE > 16
0.0/ 100
METRIC RATING
309th/ 347
METRIC RANK
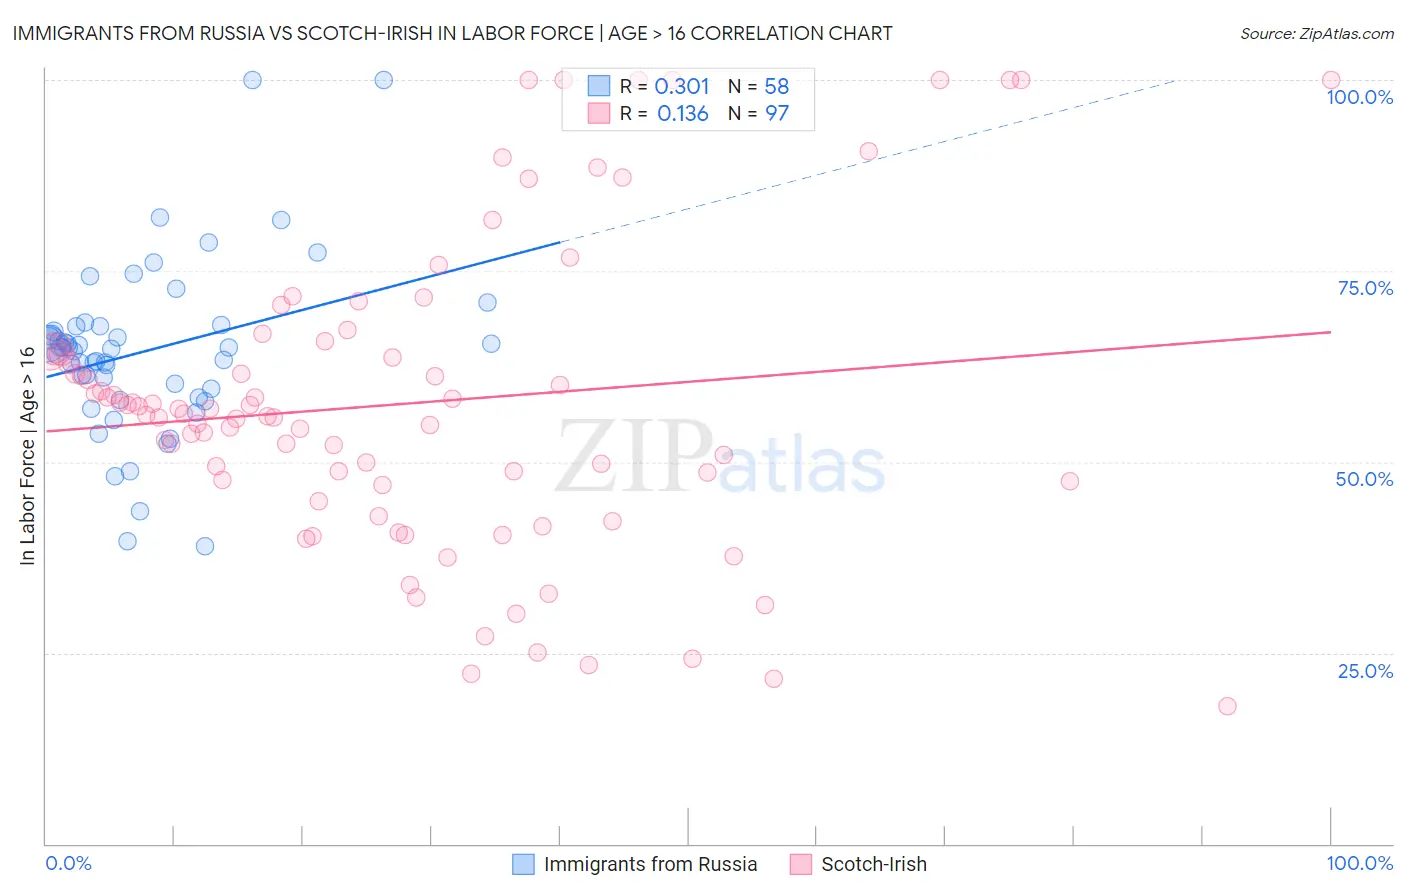
Immigrants from Russia vs Scotch-Irish In Labor Force | Age > 16 Correlation Chart
The statistical analysis conducted on geographies consisting of 347,958,587 people shows a mild positive correlation between the proportion of Immigrants from Russia and labor force participation rate among population ages 16 and over in the United States with a correlation coefficient (R) of 0.301 and weighted average of 65.3%. Similarly, the statistical analysis conducted on geographies consisting of 548,771,669 people shows a poor positive correlation between the proportion of Scotch-Irish and labor force participation rate among population ages 16 and over in the United States with a correlation coefficient (R) of 0.136 and weighted average of 63.3%, a difference of 3.2%.
In Labor Force | Age > 16 Correlation Summary
| Measurement | Immigrants from Russia | Scotch-Irish |
| Minimum | 38.9% | 18.0% |
| Maximum | 100.0% | 100.0% |
| Range | 61.1% | 82.0% |
| Mean | 64.5% | 57.6% |
| Median | 64.9% | 56.2% |
| Interquartile 25% (IQ1) | 59.6% | 47.2% |
| Interquartile 75% (IQ3) | 67.7% | 64.5% |
| Interquartile Range (IQR) | 8.1% | 17.3% |
| Standard Deviation (Sample) | 11.1% | 19.8% |
| Standard Deviation (Population) | 11.0% | 19.7% |
Similar Demographics by In Labor Force | Age > 16
Demographics Similar to Immigrants from Russia by In Labor Force | Age > 16
In terms of in labor force | age > 16, the demographic groups most similar to Immigrants from Russia are Immigrants from Ireland (65.3%, a difference of 0.0%), Immigrants from Armenia (65.3%, a difference of 0.010%), Panamanian (65.3%, a difference of 0.010%), Immigrants from Syria (65.3%, a difference of 0.020%), and Immigrants from South Africa (65.3%, a difference of 0.030%).
| Demographics | Rating | Rank | In Labor Force | Age > 16 |
| Immigrants | Immigrants | 81.9 /100 | #150 | Excellent 65.4% |
| Czechs | 81.5 /100 | #151 | Excellent 65.4% |
| Yugoslavians | 81.3 /100 | #152 | Excellent 65.4% |
| Immigrants | China | 80.5 /100 | #153 | Excellent 65.4% |
| Immigrants | Eastern Europe | 78.3 /100 | #154 | Good 65.4% |
| Immigrants | Armenia | 76.6 /100 | #155 | Good 65.3% |
| Immigrants | Ireland | 75.9 /100 | #156 | Good 65.3% |
| Immigrants | Russia | 75.7 /100 | #157 | Good 65.3% |
| Panamanians | 75.2 /100 | #158 | Good 65.3% |
| Immigrants | Syria | 74.6 /100 | #159 | Good 65.3% |
| Immigrants | South Africa | 73.5 /100 | #160 | Good 65.3% |
| Australians | 71.3 /100 | #161 | Good 65.3% |
| Albanians | 70.8 /100 | #162 | Good 65.3% |
| South Africans | 69.8 /100 | #163 | Good 65.3% |
| Danes | 68.8 /100 | #164 | Good 65.3% |
Demographics Similar to Scotch-Irish by In Labor Force | Age > 16
In terms of in labor force | age > 16, the demographic groups most similar to Scotch-Irish are Shoshone (63.2%, a difference of 0.070%), Blackfeet (63.2%, a difference of 0.080%), Pennsylvania German (63.4%, a difference of 0.13%), Iroquois (63.2%, a difference of 0.14%), and Central American Indian (63.4%, a difference of 0.17%).
| Demographics | Rating | Rank | In Labor Force | Age > 16 |
| Delaware | 0.0 /100 | #302 | Tragic 63.6% |
| Cree | 0.0 /100 | #303 | Tragic 63.5% |
| Immigrants | Nonimmigrants | 0.0 /100 | #304 | Tragic 63.5% |
| Osage | 0.0 /100 | #305 | Tragic 63.5% |
| Blacks/African Americans | 0.0 /100 | #306 | Tragic 63.4% |
| Central American Indians | 0.0 /100 | #307 | Tragic 63.4% |
| Pennsylvania Germans | 0.0 /100 | #308 | Tragic 63.4% |
| Scotch-Irish | 0.0 /100 | #309 | Tragic 63.3% |
| Shoshone | 0.0 /100 | #310 | Tragic 63.2% |
| Blackfeet | 0.0 /100 | #311 | Tragic 63.2% |
| Iroquois | 0.0 /100 | #312 | Tragic 63.2% |
| Chippewa | 0.0 /100 | #313 | Tragic 63.1% |
| Yaqui | 0.0 /100 | #314 | Tragic 63.0% |
| Potawatomi | 0.0 /100 | #315 | Tragic 62.8% |
| Yup'ik | 0.0 /100 | #316 | Tragic 62.7% |