English vs Immigrants from Mexico In Labor Force | Age > 16
COMPARE
English
Immigrants from Mexico
In Labor Force | Age > 16
In Labor Force | Age > 16 Comparison
English
Immigrants from Mexico
63.7%
IN LABOR FORCE | AGE > 16
0.1/ 100
METRIC RATING
293rd/ 347
METRIC RANK
64.3%
IN LABOR FORCE | AGE > 16
1.0/ 100
METRIC RATING
256th/ 347
METRIC RANK
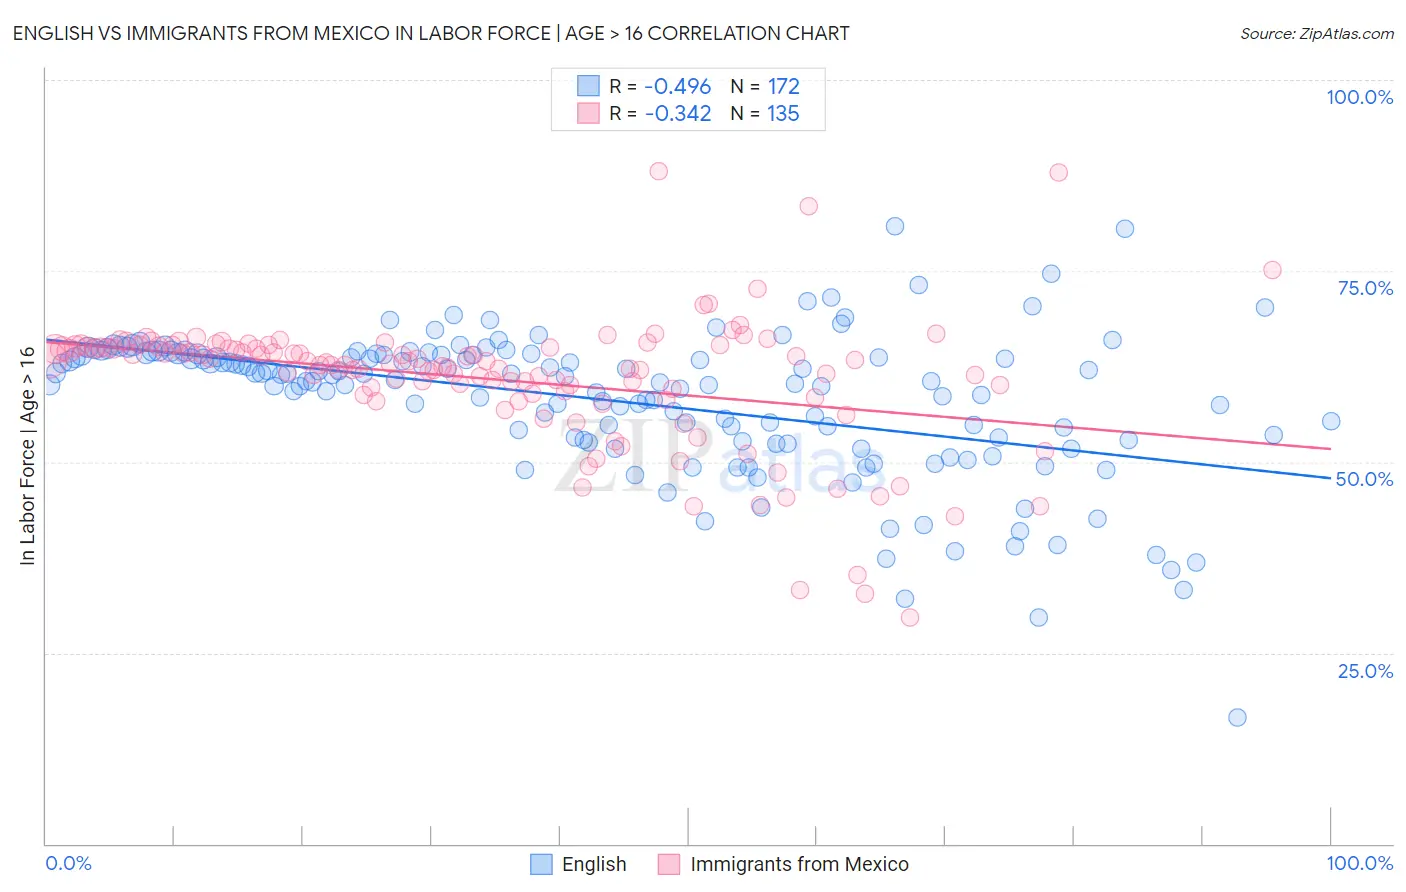
English vs Immigrants from Mexico In Labor Force | Age > 16 Correlation Chart
The statistical analysis conducted on geographies consisting of 579,971,917 people shows a moderate negative correlation between the proportion of English and labor force participation rate among population ages 16 and over in the United States with a correlation coefficient (R) of -0.496 and weighted average of 63.7%. Similarly, the statistical analysis conducted on geographies consisting of 513,718,748 people shows a mild negative correlation between the proportion of Immigrants from Mexico and labor force participation rate among population ages 16 and over in the United States with a correlation coefficient (R) of -0.342 and weighted average of 64.3%, a difference of 0.84%.
In Labor Force | Age > 16 Correlation Summary
| Measurement | English | Immigrants from Mexico |
| Minimum | 16.6% | 29.7% |
| Maximum | 80.8% | 88.0% |
| Range | 64.2% | 58.3% |
| Mean | 58.1% | 60.8% |
| Median | 61.0% | 62.9% |
| Interquartile 25% (IQ1) | 53.1% | 59.0% |
| Interquartile 75% (IQ3) | 64.1% | 65.1% |
| Interquartile Range (IQR) | 11.1% | 6.1% |
| Standard Deviation (Sample) | 9.5% | 8.7% |
| Standard Deviation (Population) | 9.5% | 8.7% |
Similar Demographics by In Labor Force | Age > 16
Demographics Similar to English by In Labor Force | Age > 16
In terms of in labor force | age > 16, the demographic groups most similar to English are Puget Sound Salish (63.7%, a difference of 0.030%), Spanish American Indian (63.8%, a difference of 0.040%), Immigrants from Canada (63.7%, a difference of 0.080%), Nepalese (63.8%, a difference of 0.10%), and Immigrants from North America (63.7%, a difference of 0.10%).
| Demographics | Rating | Rank | In Labor Force | Age > 16 |
| Immigrants | Austria | 0.1 /100 | #286 | Tragic 63.9% |
| Scottish | 0.1 /100 | #287 | Tragic 63.9% |
| Spanish | 0.1 /100 | #288 | Tragic 63.9% |
| Celtics | 0.1 /100 | #289 | Tragic 63.8% |
| Hungarians | 0.1 /100 | #290 | Tragic 63.8% |
| Nepalese | 0.1 /100 | #291 | Tragic 63.8% |
| Spanish American Indians | 0.1 /100 | #292 | Tragic 63.8% |
| English | 0.1 /100 | #293 | Tragic 63.7% |
| Puget Sound Salish | 0.0 /100 | #294 | Tragic 63.7% |
| Immigrants | Canada | 0.0 /100 | #295 | Tragic 63.7% |
| Immigrants | North America | 0.0 /100 | #296 | Tragic 63.7% |
| Immigrants | Grenada | 0.0 /100 | #297 | Tragic 63.6% |
| Comanche | 0.0 /100 | #298 | Tragic 63.6% |
| Whites/Caucasians | 0.0 /100 | #299 | Tragic 63.6% |
| Immigrants | Azores | 0.0 /100 | #300 | Tragic 63.6% |
Demographics Similar to Immigrants from Mexico by In Labor Force | Age > 16
In terms of in labor force | age > 16, the demographic groups most similar to Immigrants from Mexico are Hispanic or Latino (64.3%, a difference of 0.040%), Inupiat (64.3%, a difference of 0.040%), Immigrants from Scotland (64.2%, a difference of 0.060%), Immigrants from Western Europe (64.2%, a difference of 0.090%), and Marshallese (64.2%, a difference of 0.090%).
| Demographics | Rating | Rank | In Labor Force | Age > 16 |
| Germans | 1.8 /100 | #249 | Tragic 64.4% |
| British West Indians | 1.8 /100 | #250 | Tragic 64.4% |
| Portuguese | 1.6 /100 | #251 | Tragic 64.4% |
| Immigrants | Dominican Republic | 1.5 /100 | #252 | Tragic 64.4% |
| Czechoslovakians | 1.4 /100 | #253 | Tragic 64.3% |
| Immigrants | Uzbekistan | 1.4 /100 | #254 | Tragic 64.3% |
| Hispanics or Latinos | 1.1 /100 | #255 | Tragic 64.3% |
| Immigrants | Mexico | 1.0 /100 | #256 | Tragic 64.3% |
| Inupiat | 0.8 /100 | #257 | Tragic 64.3% |
| Immigrants | Scotland | 0.8 /100 | #258 | Tragic 64.2% |
| Immigrants | Western Europe | 0.7 /100 | #259 | Tragic 64.2% |
| Marshallese | 0.7 /100 | #260 | Tragic 64.2% |
| Basques | 0.7 /100 | #261 | Tragic 64.2% |
| Finns | 0.7 /100 | #262 | Tragic 64.2% |
| Bahamians | 0.6 /100 | #263 | Tragic 64.2% |