Immigrants from Cabo Verde vs Immigrants from Mexico In Labor Force | Age > 16
COMPARE
Immigrants from Cabo Verde
Immigrants from Mexico
In Labor Force | Age > 16
In Labor Force | Age > 16 Comparison
Immigrants from Cabo Verde
Immigrants from Mexico
67.3%
IN LABOR FORCE | AGE > 16
100.0/ 100
METRIC RATING
26th/ 347
METRIC RANK
64.3%
IN LABOR FORCE | AGE > 16
1.0/ 100
METRIC RATING
256th/ 347
METRIC RANK
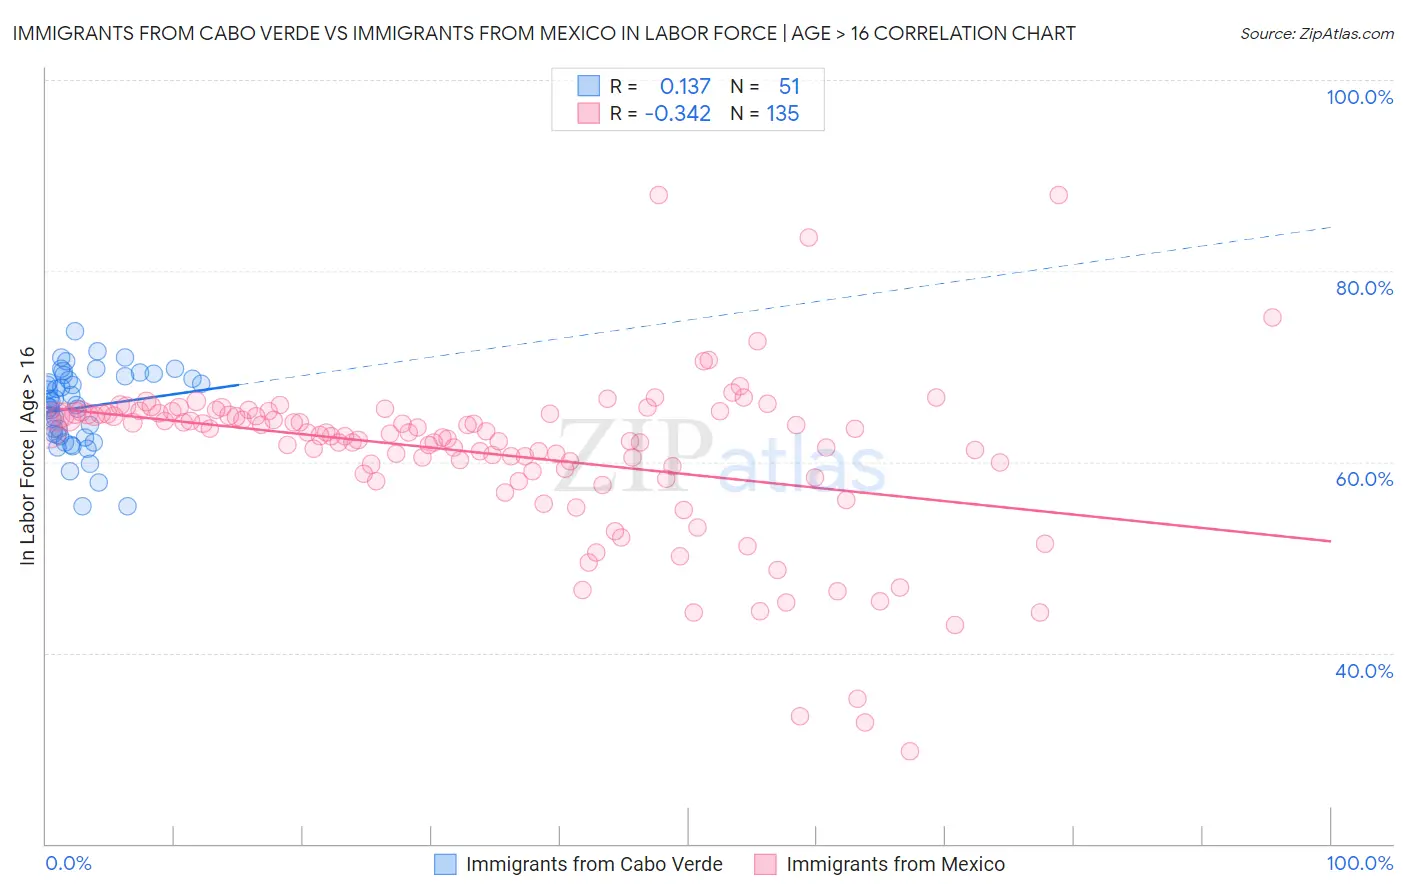
Immigrants from Cabo Verde vs Immigrants from Mexico In Labor Force | Age > 16 Correlation Chart
The statistical analysis conducted on geographies consisting of 38,158,316 people shows a poor positive correlation between the proportion of Immigrants from Cabo Verde and labor force participation rate among population ages 16 and over in the United States with a correlation coefficient (R) of 0.137 and weighted average of 67.3%. Similarly, the statistical analysis conducted on geographies consisting of 513,718,748 people shows a mild negative correlation between the proportion of Immigrants from Mexico and labor force participation rate among population ages 16 and over in the United States with a correlation coefficient (R) of -0.342 and weighted average of 64.3%, a difference of 4.8%.
In Labor Force | Age > 16 Correlation Summary
| Measurement | Immigrants from Cabo Verde | Immigrants from Mexico |
| Minimum | 55.4% | 29.7% |
| Maximum | 73.7% | 88.0% |
| Range | 18.3% | 58.3% |
| Mean | 65.7% | 60.8% |
| Median | 66.3% | 62.9% |
| Interquartile 25% (IQ1) | 62.6% | 59.0% |
| Interquartile 75% (IQ3) | 69.0% | 65.1% |
| Interquartile Range (IQR) | 6.4% | 6.1% |
| Standard Deviation (Sample) | 4.1% | 8.7% |
| Standard Deviation (Population) | 4.1% | 8.7% |
Similar Demographics by In Labor Force | Age > 16
Demographics Similar to Immigrants from Cabo Verde by In Labor Force | Age > 16
In terms of in labor force | age > 16, the demographic groups most similar to Immigrants from Cabo Verde are Immigrants from Africa (67.4%, a difference of 0.030%), Ugandan (67.4%, a difference of 0.050%), Zimbabwean (67.3%, a difference of 0.080%), Cambodian (67.4%, a difference of 0.12%), and Immigrants from Morocco (67.2%, a difference of 0.16%).
| Demographics | Rating | Rank | In Labor Force | Age > 16 |
| Kenyans | 100.0 /100 | #19 | Exceptional 67.6% |
| Immigrants | Kenya | 100.0 /100 | #20 | Exceptional 67.6% |
| Tongans | 100.0 /100 | #21 | Exceptional 67.5% |
| Immigrants | Uganda | 100.0 /100 | #22 | Exceptional 67.5% |
| Cambodians | 100.0 /100 | #23 | Exceptional 67.4% |
| Ugandans | 100.0 /100 | #24 | Exceptional 67.4% |
| Immigrants | Africa | 100.0 /100 | #25 | Exceptional 67.4% |
| Immigrants | Cabo Verde | 100.0 /100 | #26 | Exceptional 67.3% |
| Zimbabweans | 100.0 /100 | #27 | Exceptional 67.3% |
| Immigrants | Morocco | 100.0 /100 | #28 | Exceptional 67.2% |
| Thais | 100.0 /100 | #29 | Exceptional 67.2% |
| Immigrants | Zaire | 100.0 /100 | #30 | Exceptional 67.2% |
| Ghanaians | 100.0 /100 | #31 | Exceptional 67.1% |
| Immigrants | Congo | 100.0 /100 | #32 | Exceptional 67.1% |
| Afghans | 100.0 /100 | #33 | Exceptional 67.1% |
Demographics Similar to Immigrants from Mexico by In Labor Force | Age > 16
In terms of in labor force | age > 16, the demographic groups most similar to Immigrants from Mexico are Hispanic or Latino (64.3%, a difference of 0.040%), Inupiat (64.3%, a difference of 0.040%), Immigrants from Scotland (64.2%, a difference of 0.060%), Immigrants from Western Europe (64.2%, a difference of 0.090%), and Marshallese (64.2%, a difference of 0.090%).
| Demographics | Rating | Rank | In Labor Force | Age > 16 |
| Germans | 1.8 /100 | #249 | Tragic 64.4% |
| British West Indians | 1.8 /100 | #250 | Tragic 64.4% |
| Portuguese | 1.6 /100 | #251 | Tragic 64.4% |
| Immigrants | Dominican Republic | 1.5 /100 | #252 | Tragic 64.4% |
| Czechoslovakians | 1.4 /100 | #253 | Tragic 64.3% |
| Immigrants | Uzbekistan | 1.4 /100 | #254 | Tragic 64.3% |
| Hispanics or Latinos | 1.1 /100 | #255 | Tragic 64.3% |
| Immigrants | Mexico | 1.0 /100 | #256 | Tragic 64.3% |
| Inupiat | 0.8 /100 | #257 | Tragic 64.3% |
| Immigrants | Scotland | 0.8 /100 | #258 | Tragic 64.2% |
| Immigrants | Western Europe | 0.7 /100 | #259 | Tragic 64.2% |
| Marshallese | 0.7 /100 | #260 | Tragic 64.2% |
| Basques | 0.7 /100 | #261 | Tragic 64.2% |
| Finns | 0.7 /100 | #262 | Tragic 64.2% |
| Bahamians | 0.6 /100 | #263 | Tragic 64.2% |