Laotian vs Immigrants from Mexico In Labor Force | Age > 16
COMPARE
Laotian
Immigrants from Mexico
In Labor Force | Age > 16
In Labor Force | Age > 16 Comparison
Laotians
Immigrants from Mexico
65.8%
IN LABOR FORCE | AGE > 16
97.4/ 100
METRIC RATING
112th/ 347
METRIC RANK
64.3%
IN LABOR FORCE | AGE > 16
1.0/ 100
METRIC RATING
256th/ 347
METRIC RANK
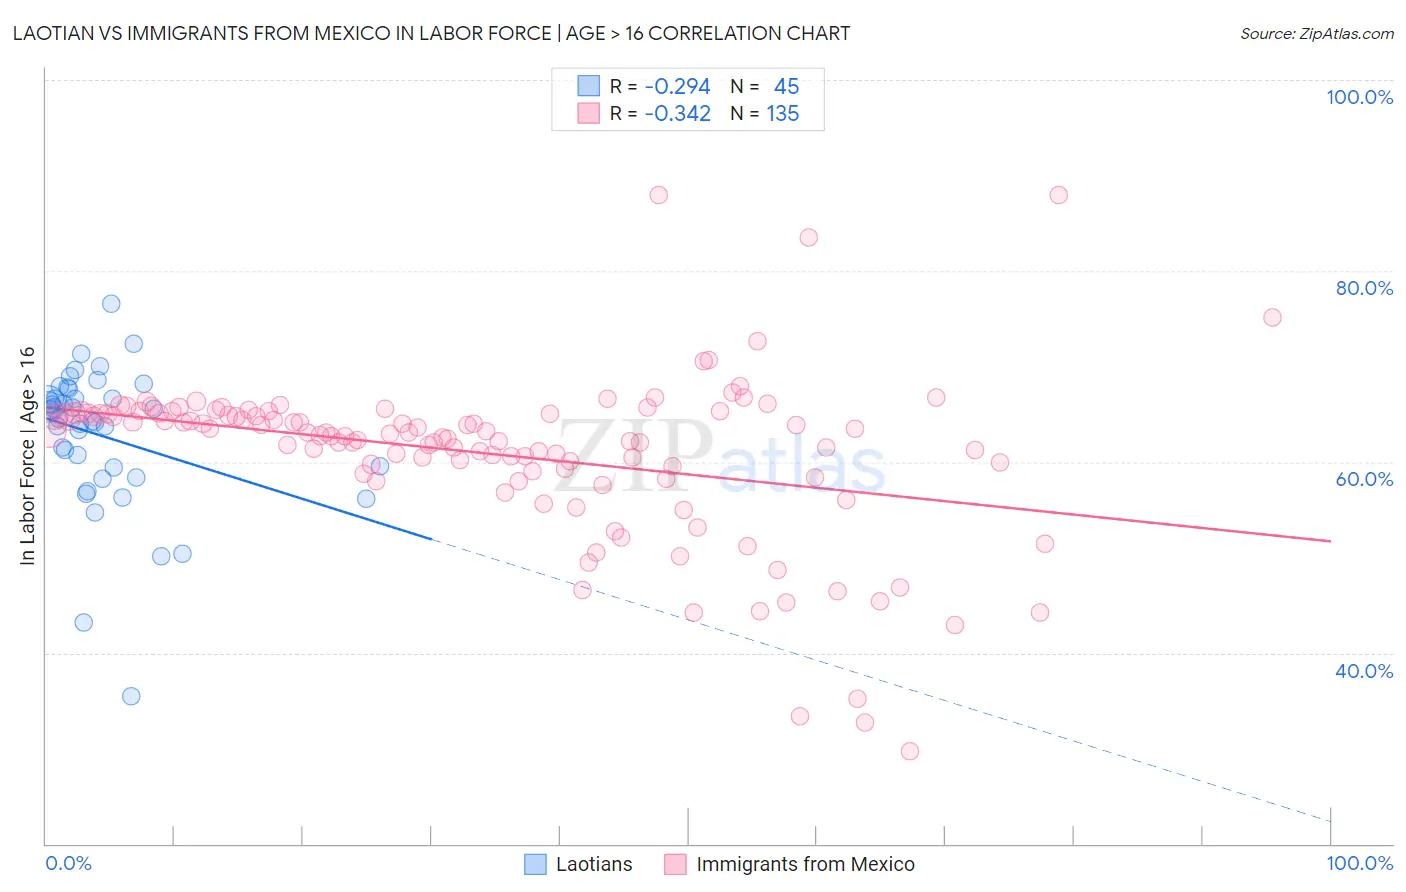
Laotian vs Immigrants from Mexico In Labor Force | Age > 16 Correlation Chart
The statistical analysis conducted on geographies consisting of 224,862,184 people shows a weak negative correlation between the proportion of Laotians and labor force participation rate among population ages 16 and over in the United States with a correlation coefficient (R) of -0.294 and weighted average of 65.8%. Similarly, the statistical analysis conducted on geographies consisting of 513,718,748 people shows a mild negative correlation between the proportion of Immigrants from Mexico and labor force participation rate among population ages 16 and over in the United States with a correlation coefficient (R) of -0.342 and weighted average of 64.3%, a difference of 2.3%.
In Labor Force | Age > 16 Correlation Summary
| Measurement | Laotian | Immigrants from Mexico |
| Minimum | 35.4% | 29.7% |
| Maximum | 76.6% | 88.0% |
| Range | 41.2% | 58.3% |
| Mean | 62.7% | 60.8% |
| Median | 64.6% | 62.9% |
| Interquartile 25% (IQ1) | 58.8% | 59.0% |
| Interquartile 75% (IQ3) | 67.2% | 65.1% |
| Interquartile Range (IQR) | 8.3% | 6.1% |
| Standard Deviation (Sample) | 7.5% | 8.7% |
| Standard Deviation (Population) | 7.5% | 8.7% |
Similar Demographics by In Labor Force | Age > 16
Demographics Similar to Laotians by In Labor Force | Age > 16
In terms of in labor force | age > 16, the demographic groups most similar to Laotians are Immigrants from Honduras (65.8%, a difference of 0.020%), Pakistani (65.8%, a difference of 0.030%), Honduran (65.8%, a difference of 0.030%), Japanese (65.8%, a difference of 0.040%), and Immigrants from Indonesia (65.7%, a difference of 0.060%).
| Demographics | Rating | Rank | In Labor Force | Age > 16 |
| Colombians | 98.4 /100 | #105 | Exceptional 65.9% |
| Immigrants | Serbia | 98.1 /100 | #106 | Exceptional 65.8% |
| Immigrants | Poland | 98.1 /100 | #107 | Exceptional 65.8% |
| Immigrants | Spain | 98.0 /100 | #108 | Exceptional 65.8% |
| Immigrants | Japan | 98.0 /100 | #109 | Exceptional 65.8% |
| Japanese | 97.7 /100 | #110 | Exceptional 65.8% |
| Immigrants | Honduras | 97.5 /100 | #111 | Exceptional 65.8% |
| Laotians | 97.4 /100 | #112 | Exceptional 65.8% |
| Pakistanis | 97.1 /100 | #113 | Exceptional 65.8% |
| Hondurans | 97.1 /100 | #114 | Exceptional 65.8% |
| Immigrants | Indonesia | 96.8 /100 | #115 | Exceptional 65.7% |
| Argentineans | 96.7 /100 | #116 | Exceptional 65.7% |
| Immigrants | Iran | 96.6 /100 | #117 | Exceptional 65.7% |
| Immigrants | Thailand | 96.6 /100 | #118 | Exceptional 65.7% |
| Immigrants | France | 96.4 /100 | #119 | Exceptional 65.7% |
Demographics Similar to Immigrants from Mexico by In Labor Force | Age > 16
In terms of in labor force | age > 16, the demographic groups most similar to Immigrants from Mexico are Hispanic or Latino (64.3%, a difference of 0.040%), Inupiat (64.3%, a difference of 0.040%), Immigrants from Scotland (64.2%, a difference of 0.060%), Immigrants from Western Europe (64.2%, a difference of 0.090%), and Marshallese (64.2%, a difference of 0.090%).
| Demographics | Rating | Rank | In Labor Force | Age > 16 |
| Germans | 1.8 /100 | #249 | Tragic 64.4% |
| British West Indians | 1.8 /100 | #250 | Tragic 64.4% |
| Portuguese | 1.6 /100 | #251 | Tragic 64.4% |
| Immigrants | Dominican Republic | 1.5 /100 | #252 | Tragic 64.4% |
| Czechoslovakians | 1.4 /100 | #253 | Tragic 64.3% |
| Immigrants | Uzbekistan | 1.4 /100 | #254 | Tragic 64.3% |
| Hispanics or Latinos | 1.1 /100 | #255 | Tragic 64.3% |
| Immigrants | Mexico | 1.0 /100 | #256 | Tragic 64.3% |
| Inupiat | 0.8 /100 | #257 | Tragic 64.3% |
| Immigrants | Scotland | 0.8 /100 | #258 | Tragic 64.2% |
| Immigrants | Western Europe | 0.7 /100 | #259 | Tragic 64.2% |
| Marshallese | 0.7 /100 | #260 | Tragic 64.2% |
| Basques | 0.7 /100 | #261 | Tragic 64.2% |
| Finns | 0.7 /100 | #262 | Tragic 64.2% |
| Bahamians | 0.6 /100 | #263 | Tragic 64.2% |