Immigrants from Russia vs Immigrants from Mexico In Labor Force | Age 25-29
COMPARE
Immigrants from Russia
Immigrants from Mexico
In Labor Force | Age 25-29
In Labor Force | Age 25-29 Comparison
Immigrants from Russia
Immigrants from Mexico
84.9%
IN LABOR FORCE | AGE 25-29
81.6/ 100
METRIC RATING
129th/ 347
METRIC RANK
82.0%
IN LABOR FORCE | AGE 25-29
0.0/ 100
METRIC RATING
315th/ 347
METRIC RANK
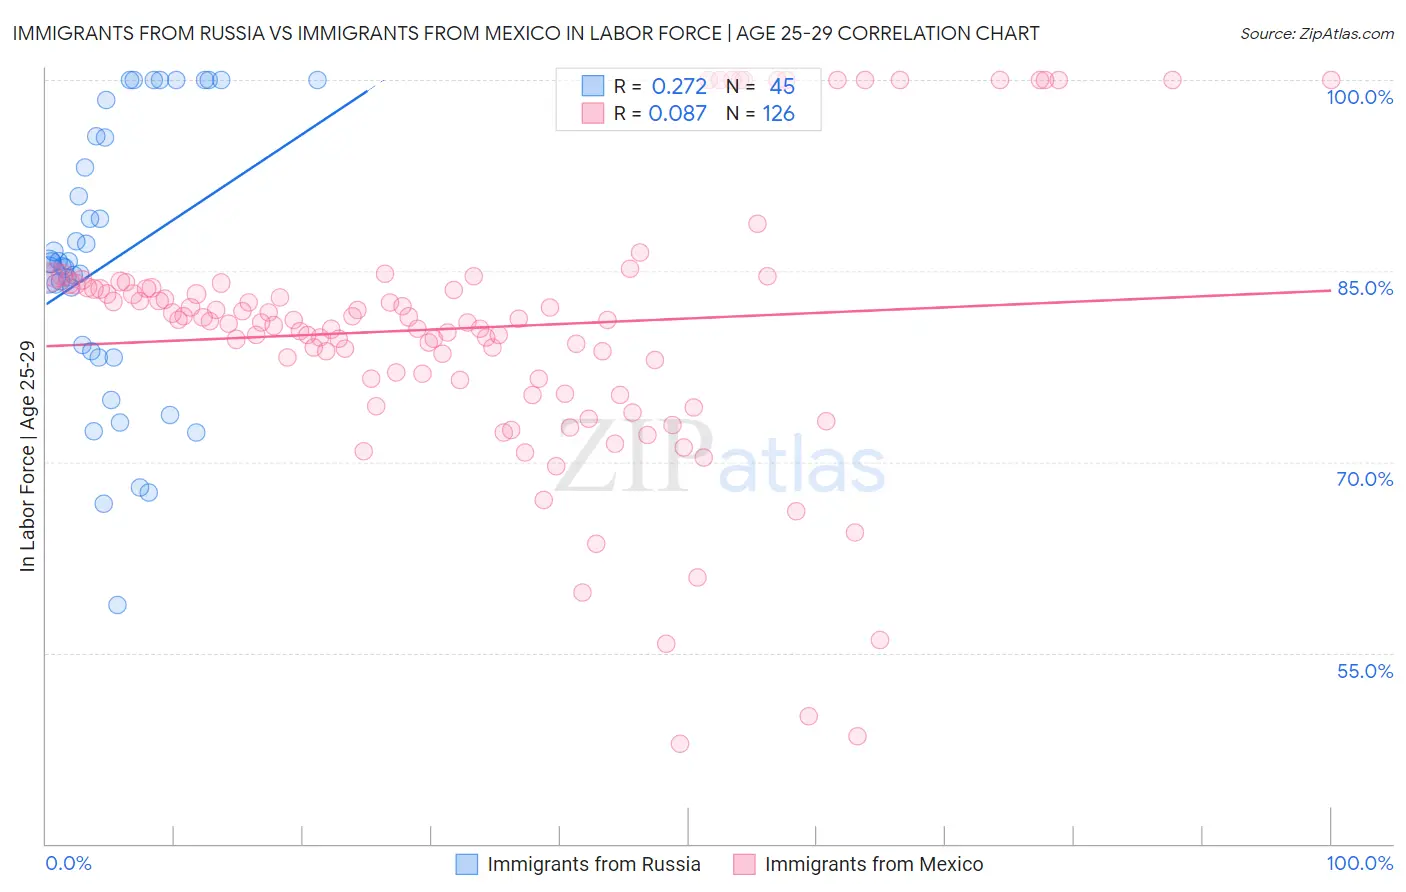
Immigrants from Russia vs Immigrants from Mexico In Labor Force | Age 25-29 Correlation Chart
The statistical analysis conducted on geographies consisting of 347,809,733 people shows a weak positive correlation between the proportion of Immigrants from Russia and labor force participation rate among population between the ages 25 and 29 in the United States with a correlation coefficient (R) of 0.272 and weighted average of 84.9%. Similarly, the statistical analysis conducted on geographies consisting of 513,205,790 people shows a slight positive correlation between the proportion of Immigrants from Mexico and labor force participation rate among population between the ages 25 and 29 in the United States with a correlation coefficient (R) of 0.087 and weighted average of 82.0%, a difference of 3.5%.
In Labor Force | Age 25-29 Correlation Summary
| Measurement | Immigrants from Russia | Immigrants from Mexico |
| Minimum | 58.8% | 47.9% |
| Maximum | 100.0% | 100.0% |
| Range | 41.2% | 52.1% |
| Mean | 85.7% | 80.5% |
| Median | 85.7% | 81.1% |
| Interquartile 25% (IQ1) | 78.5% | 76.5% |
| Interquartile 75% (IQ3) | 95.5% | 83.7% |
| Interquartile Range (IQR) | 17.1% | 7.2% |
| Standard Deviation (Sample) | 10.7% | 10.5% |
| Standard Deviation (Population) | 10.6% | 10.5% |
Similar Demographics by In Labor Force | Age 25-29
Demographics Similar to Immigrants from Russia by In Labor Force | Age 25-29
In terms of in labor force | age 25-29, the demographic groups most similar to Immigrants from Russia are Northern European (84.9%, a difference of 0.0%), Immigrants from Uruguay (84.9%, a difference of 0.030%), Australian (84.9%, a difference of 0.030%), Dutch (84.9%, a difference of 0.040%), and Immigrants from Iran (84.9%, a difference of 0.040%).
| Demographics | Rating | Rank | In Labor Force | Age 25-29 |
| Scandinavians | 85.1 /100 | #122 | Excellent 84.9% |
| Dutch | 84.9 /100 | #123 | Excellent 84.9% |
| Immigrants | Iran | 84.8 /100 | #124 | Excellent 84.9% |
| Uruguayans | 84.7 /100 | #125 | Excellent 84.9% |
| Immigrants | Singapore | 84.4 /100 | #126 | Excellent 84.9% |
| Immigrants | Uruguay | 84.0 /100 | #127 | Excellent 84.9% |
| Australians | 83.6 /100 | #128 | Excellent 84.9% |
| Immigrants | Russia | 81.6 /100 | #129 | Excellent 84.9% |
| Northern Europeans | 81.3 /100 | #130 | Excellent 84.9% |
| Iranians | 78.1 /100 | #131 | Good 84.8% |
| Romanians | 77.7 /100 | #132 | Good 84.8% |
| Asians | 77.7 /100 | #133 | Good 84.8% |
| Syrians | 76.5 /100 | #134 | Good 84.8% |
| Immigrants | Hungary | 76.4 /100 | #135 | Good 84.8% |
| Bhutanese | 76.0 /100 | #136 | Good 84.8% |
Demographics Similar to Immigrants from Mexico by In Labor Force | Age 25-29
In terms of in labor force | age 25-29, the demographic groups most similar to Immigrants from Mexico are Mexican (81.9%, a difference of 0.090%), Cherokee (82.1%, a difference of 0.13%), Chickasaw (81.9%, a difference of 0.16%), Comanche (81.9%, a difference of 0.17%), and Yaqui (82.2%, a difference of 0.18%).
| Demographics | Rating | Rank | In Labor Force | Age 25-29 |
| Central American Indians | 0.0 /100 | #308 | Tragic 82.4% |
| Immigrants | Central America | 0.0 /100 | #309 | Tragic 82.4% |
| Osage | 0.0 /100 | #310 | Tragic 82.3% |
| Alaskan Athabascans | 0.0 /100 | #311 | Tragic 82.3% |
| Hispanics or Latinos | 0.0 /100 | #312 | Tragic 82.2% |
| Yaqui | 0.0 /100 | #313 | Tragic 82.2% |
| Cherokee | 0.0 /100 | #314 | Tragic 82.1% |
| Immigrants | Mexico | 0.0 /100 | #315 | Tragic 82.0% |
| Mexicans | 0.0 /100 | #316 | Tragic 81.9% |
| Chickasaw | 0.0 /100 | #317 | Tragic 81.9% |
| Comanche | 0.0 /100 | #318 | Tragic 81.9% |
| Seminole | 0.0 /100 | #319 | Tragic 81.7% |
| Colville | 0.0 /100 | #320 | Tragic 81.6% |
| Shoshone | 0.0 /100 | #321 | Tragic 81.6% |
| Kiowa | 0.0 /100 | #322 | Tragic 81.6% |