Immigrants from Russia vs Iranian In Labor Force | Age > 16
COMPARE
Immigrants from Russia
Iranian
In Labor Force | Age > 16
In Labor Force | Age > 16 Comparison
Immigrants from Russia
Iranians
65.3%
IN LABOR FORCE | AGE > 16
75.7/ 100
METRIC RATING
157th/ 347
METRIC RANK
66.0%
IN LABOR FORCE | AGE > 16
99.2/ 100
METRIC RATING
91st/ 347
METRIC RANK
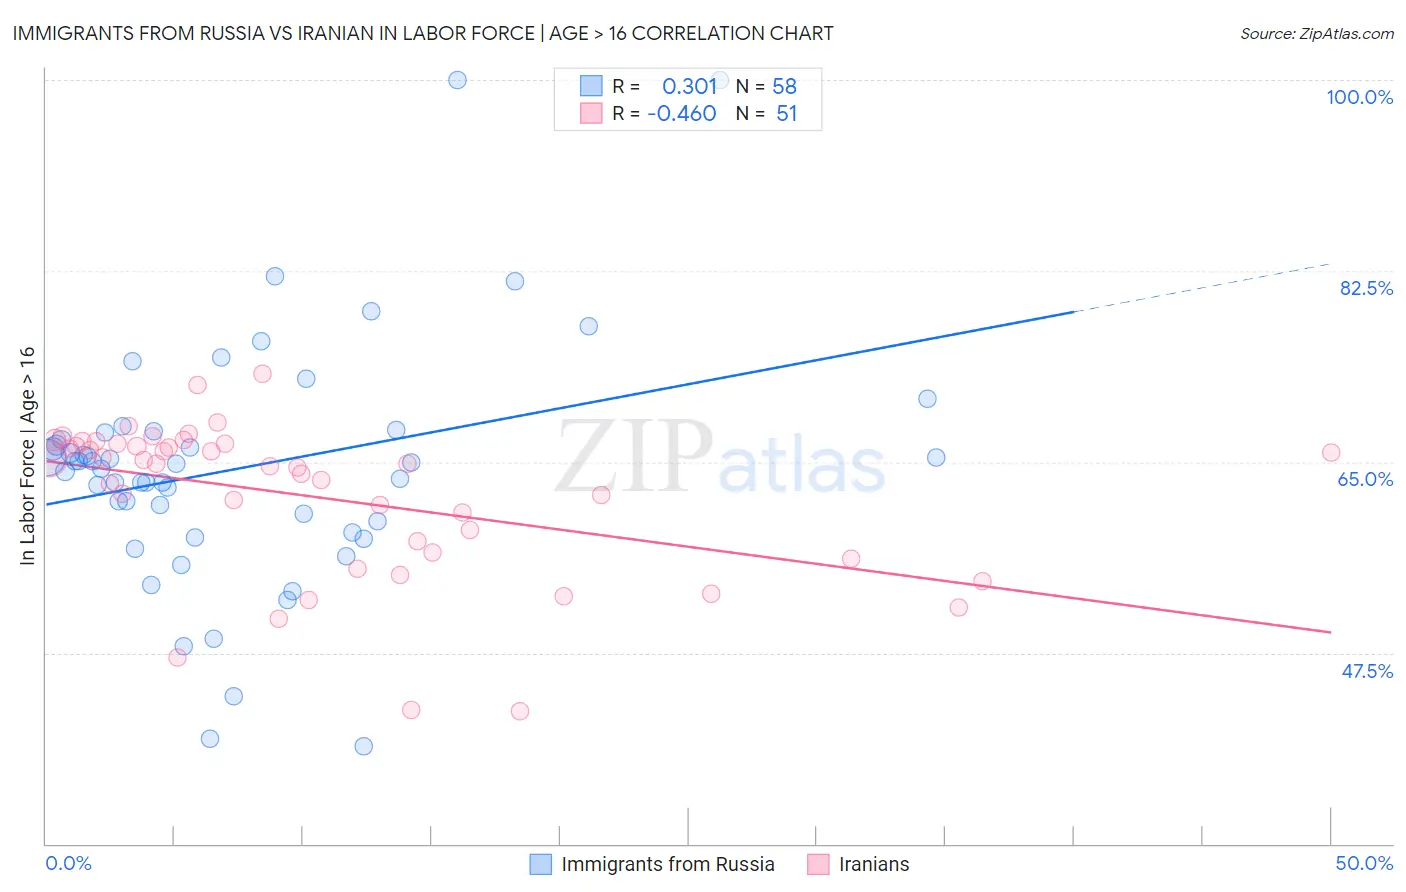
Immigrants from Russia vs Iranian In Labor Force | Age > 16 Correlation Chart
The statistical analysis conducted on geographies consisting of 347,958,587 people shows a mild positive correlation between the proportion of Immigrants from Russia and labor force participation rate among population ages 16 and over in the United States with a correlation coefficient (R) of 0.301 and weighted average of 65.3%. Similarly, the statistical analysis conducted on geographies consisting of 316,907,854 people shows a moderate negative correlation between the proportion of Iranians and labor force participation rate among population ages 16 and over in the United States with a correlation coefficient (R) of -0.460 and weighted average of 66.0%, a difference of 1.0%.
In Labor Force | Age > 16 Correlation Summary
| Measurement | Immigrants from Russia | Iranian |
| Minimum | 38.9% | 42.1% |
| Maximum | 100.0% | 73.0% |
| Range | 61.1% | 30.9% |
| Mean | 64.5% | 61.8% |
| Median | 64.9% | 64.8% |
| Interquartile 25% (IQ1) | 59.6% | 56.7% |
| Interquartile 75% (IQ3) | 67.7% | 66.7% |
| Interquartile Range (IQR) | 8.1% | 10.0% |
| Standard Deviation (Sample) | 11.1% | 7.1% |
| Standard Deviation (Population) | 11.0% | 7.0% |
Similar Demographics by In Labor Force | Age > 16
Demographics Similar to Immigrants from Russia by In Labor Force | Age > 16
In terms of in labor force | age > 16, the demographic groups most similar to Immigrants from Russia are Immigrants from Ireland (65.3%, a difference of 0.0%), Immigrants from Armenia (65.3%, a difference of 0.010%), Panamanian (65.3%, a difference of 0.010%), Immigrants from Syria (65.3%, a difference of 0.020%), and Immigrants from South Africa (65.3%, a difference of 0.030%).
| Demographics | Rating | Rank | In Labor Force | Age > 16 |
| Immigrants | Immigrants | 81.9 /100 | #150 | Excellent 65.4% |
| Czechs | 81.5 /100 | #151 | Excellent 65.4% |
| Yugoslavians | 81.3 /100 | #152 | Excellent 65.4% |
| Immigrants | China | 80.5 /100 | #153 | Excellent 65.4% |
| Immigrants | Eastern Europe | 78.3 /100 | #154 | Good 65.4% |
| Immigrants | Armenia | 76.6 /100 | #155 | Good 65.3% |
| Immigrants | Ireland | 75.9 /100 | #156 | Good 65.3% |
| Immigrants | Russia | 75.7 /100 | #157 | Good 65.3% |
| Panamanians | 75.2 /100 | #158 | Good 65.3% |
| Immigrants | Syria | 74.6 /100 | #159 | Good 65.3% |
| Immigrants | South Africa | 73.5 /100 | #160 | Good 65.3% |
| Australians | 71.3 /100 | #161 | Good 65.3% |
| Albanians | 70.8 /100 | #162 | Good 65.3% |
| South Africans | 69.8 /100 | #163 | Good 65.3% |
| Danes | 68.8 /100 | #164 | Good 65.3% |
Demographics Similar to Iranians by In Labor Force | Age > 16
In terms of in labor force | age > 16, the demographic groups most similar to Iranians are Immigrants from Laos (66.0%, a difference of 0.010%), Chilean (66.0%, a difference of 0.010%), Aleut (66.0%, a difference of 0.020%), Immigrants from South America (66.0%, a difference of 0.030%), and Immigrants from Cambodia (66.0%, a difference of 0.040%).
| Demographics | Rating | Rank | In Labor Force | Age > 16 |
| Central Americans | 99.4 /100 | #84 | Exceptional 66.1% |
| Mongolians | 99.4 /100 | #85 | Exceptional 66.1% |
| South Americans | 99.4 /100 | #86 | Exceptional 66.0% |
| South American Indians | 99.4 /100 | #87 | Exceptional 66.0% |
| Bermudans | 99.3 /100 | #88 | Exceptional 66.0% |
| Immigrants | Laos | 99.2 /100 | #89 | Exceptional 66.0% |
| Chileans | 99.2 /100 | #90 | Exceptional 66.0% |
| Iranians | 99.2 /100 | #91 | Exceptional 66.0% |
| Aleuts | 99.1 /100 | #92 | Exceptional 66.0% |
| Immigrants | South America | 99.1 /100 | #93 | Exceptional 66.0% |
| Immigrants | Cambodia | 99.1 /100 | #94 | Exceptional 66.0% |
| Immigrants | Uruguay | 99.1 /100 | #95 | Exceptional 66.0% |
| Bangladeshis | 98.9 /100 | #96 | Exceptional 65.9% |
| Filipinos | 98.9 /100 | #97 | Exceptional 65.9% |
| Immigrants | Chile | 98.7 /100 | #98 | Exceptional 65.9% |