Immigrants from Russia vs Immigrants from Mexico Unemployment Among Youth under 25 years
COMPARE
Immigrants from Russia
Immigrants from Mexico
Unemployment Among Youth under 25 years
Unemployment Among Youth under 25 years Comparison
Immigrants from Russia
Immigrants from Mexico
11.7%
UNEMPLOYMENT AMONG YOUTH UNDER 25 YEARS
28.5/ 100
METRIC RATING
192nd/ 347
METRIC RANK
12.4%
UNEMPLOYMENT AMONG YOUTH UNDER 25 YEARS
0.1/ 100
METRIC RATING
262nd/ 347
METRIC RANK
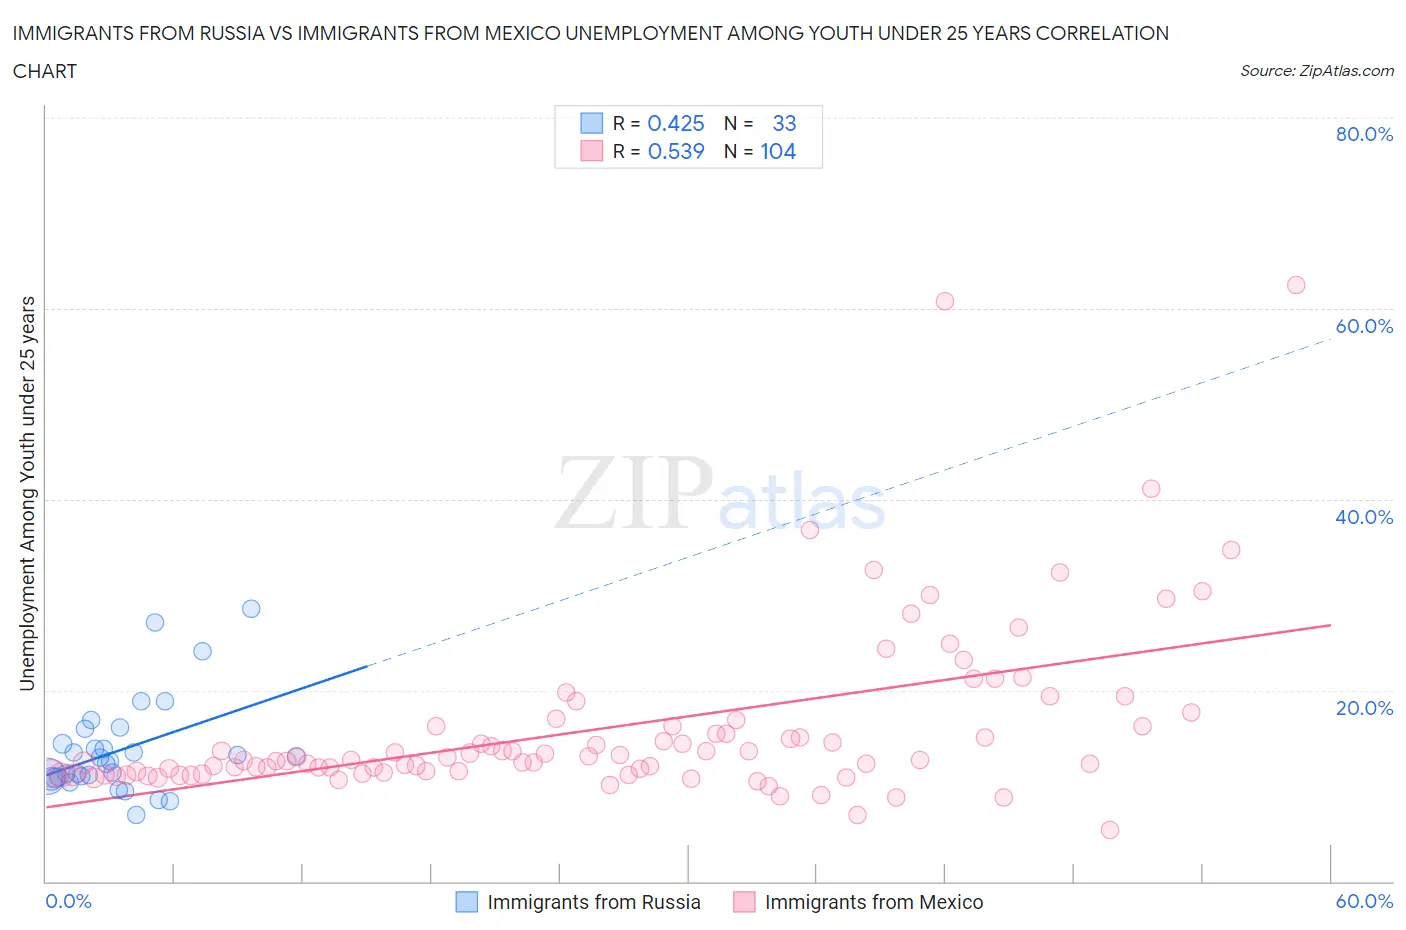
Immigrants from Russia vs Immigrants from Mexico Unemployment Among Youth under 25 years Correlation Chart
The statistical analysis conducted on geographies consisting of 344,363,065 people shows a moderate positive correlation between the proportion of Immigrants from Russia and unemployment rate among youth under the age of 25 in the United States with a correlation coefficient (R) of 0.425 and weighted average of 11.7%. Similarly, the statistical analysis conducted on geographies consisting of 500,400,910 people shows a substantial positive correlation between the proportion of Immigrants from Mexico and unemployment rate among youth under the age of 25 in the United States with a correlation coefficient (R) of 0.539 and weighted average of 12.4%, a difference of 6.1%.
Unemployment Among Youth under 25 years Correlation Summary
| Measurement | Immigrants from Russia | Immigrants from Mexico |
| Minimum | 7.0% | 5.4% |
| Maximum | 28.5% | 62.5% |
| Range | 21.5% | 57.1% |
| Mean | 13.7% | 16.1% |
| Median | 12.6% | 12.7% |
| Interquartile 25% (IQ1) | 10.9% | 11.4% |
| Interquartile 75% (IQ3) | 15.2% | 16.3% |
| Interquartile Range (IQR) | 4.3% | 4.9% |
| Standard Deviation (Sample) | 5.0% | 9.2% |
| Standard Deviation (Population) | 4.9% | 9.2% |
Similar Demographics by Unemployment Among Youth under 25 years
Demographics Similar to Immigrants from Russia by Unemployment Among Youth under 25 years
In terms of unemployment among youth under 25 years, the demographic groups most similar to Immigrants from Russia are Cypriot (11.7%, a difference of 0.0%), Seminole (11.7%, a difference of 0.030%), Immigrants from Sri Lanka (11.7%, a difference of 0.030%), Paraguayan (11.7%, a difference of 0.070%), and Egyptian (11.7%, a difference of 0.080%).
| Demographics | Rating | Rank | Unemployment Among Youth under 25 years |
| French American Indians | 34.0 /100 | #185 | Fair 11.7% |
| Maltese | 33.9 /100 | #186 | Fair 11.7% |
| Immigrants | Egypt | 31.9 /100 | #187 | Fair 11.7% |
| Immigrants | Poland | 31.4 /100 | #188 | Fair 11.7% |
| Japanese | 30.8 /100 | #189 | Fair 11.7% |
| Portuguese | 30.3 /100 | #190 | Fair 11.7% |
| Cypriots | 28.5 /100 | #191 | Fair 11.7% |
| Immigrants | Russia | 28.5 /100 | #192 | Fair 11.7% |
| Seminole | 27.9 /100 | #193 | Fair 11.7% |
| Immigrants | Sri Lanka | 27.8 /100 | #194 | Fair 11.7% |
| Paraguayans | 27.2 /100 | #195 | Fair 11.7% |
| Egyptians | 26.9 /100 | #196 | Fair 11.7% |
| Koreans | 23.9 /100 | #197 | Fair 11.7% |
| Cherokee | 21.2 /100 | #198 | Fair 11.8% |
| Immigrants | Colombia | 20.9 /100 | #199 | Fair 11.8% |
Demographics Similar to Immigrants from Mexico by Unemployment Among Youth under 25 years
In terms of unemployment among youth under 25 years, the demographic groups most similar to Immigrants from Mexico are Immigrants from El Salvador (12.4%, a difference of 0.050%), Immigrants from Panama (12.4%, a difference of 0.060%), Cree (12.4%, a difference of 0.090%), Immigrants from Central America (12.4%, a difference of 0.36%), and Salvadoran (12.4%, a difference of 0.42%).
| Demographics | Rating | Rank | Unemployment Among Youth under 25 years |
| Hispanics or Latinos | 0.2 /100 | #255 | Tragic 12.4% |
| Liberians | 0.2 /100 | #256 | Tragic 12.4% |
| Panamanians | 0.2 /100 | #257 | Tragic 12.4% |
| Salvadorans | 0.1 /100 | #258 | Tragic 12.4% |
| Immigrants | Central America | 0.1 /100 | #259 | Tragic 12.4% |
| Immigrants | Panama | 0.1 /100 | #260 | Tragic 12.4% |
| Immigrants | El Salvador | 0.1 /100 | #261 | Tragic 12.4% |
| Immigrants | Mexico | 0.1 /100 | #262 | Tragic 12.4% |
| Cree | 0.1 /100 | #263 | Tragic 12.4% |
| Puget Sound Salish | 0.1 /100 | #264 | Tragic 12.5% |
| Nepalese | 0.0 /100 | #265 | Tragic 12.5% |
| Immigrants | Latin America | 0.0 /100 | #266 | Tragic 12.6% |
| Sub-Saharan Africans | 0.0 /100 | #267 | Tragic 12.6% |
| Tlingit-Haida | 0.0 /100 | #268 | Tragic 12.7% |
| Kiowa | 0.0 /100 | #269 | Tragic 12.7% |