Immigrants from Russia vs Immigrants from Korea In Labor Force | Age > 16
COMPARE
Immigrants from Russia
Immigrants from Korea
In Labor Force | Age > 16
In Labor Force | Age > 16 Comparison
Immigrants from Russia
Immigrants from Korea
65.3%
IN LABOR FORCE | AGE > 16
75.7/ 100
METRIC RATING
157th/ 347
METRIC RANK
66.2%
IN LABOR FORCE | AGE > 16
99.7/ 100
METRIC RATING
74th/ 347
METRIC RANK
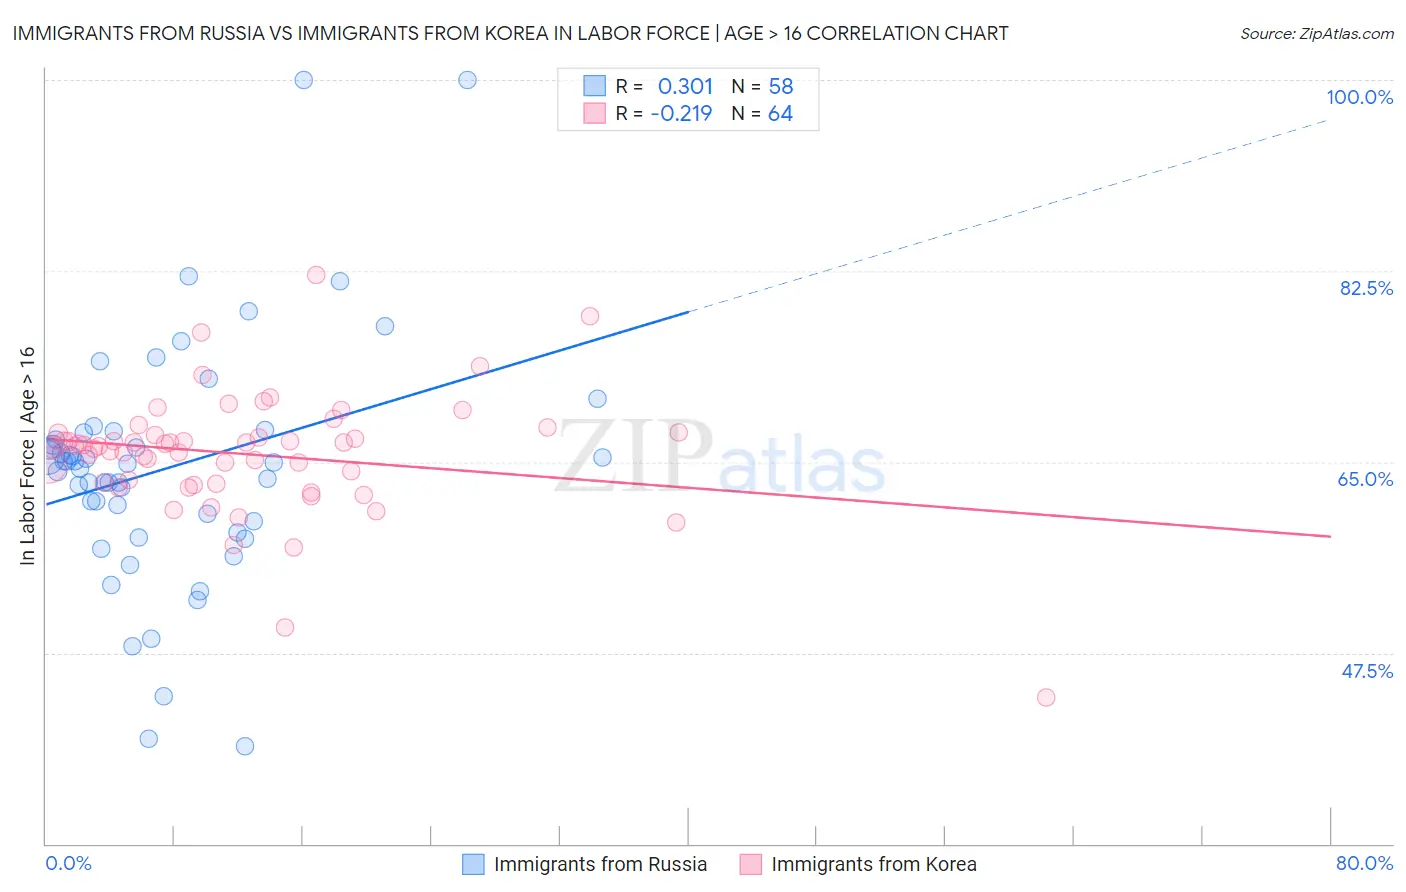
Immigrants from Russia vs Immigrants from Korea In Labor Force | Age > 16 Correlation Chart
The statistical analysis conducted on geographies consisting of 347,958,587 people shows a mild positive correlation between the proportion of Immigrants from Russia and labor force participation rate among population ages 16 and over in the United States with a correlation coefficient (R) of 0.301 and weighted average of 65.3%. Similarly, the statistical analysis conducted on geographies consisting of 416,355,366 people shows a weak negative correlation between the proportion of Immigrants from Korea and labor force participation rate among population ages 16 and over in the United States with a correlation coefficient (R) of -0.219 and weighted average of 66.2%, a difference of 1.3%.
In Labor Force | Age > 16 Correlation Summary
| Measurement | Immigrants from Russia | Immigrants from Korea |
| Minimum | 38.9% | 43.4% |
| Maximum | 100.0% | 82.1% |
| Range | 61.1% | 38.7% |
| Mean | 64.5% | 65.7% |
| Median | 64.9% | 66.5% |
| Interquartile 25% (IQ1) | 59.6% | 63.1% |
| Interquartile 75% (IQ3) | 67.7% | 67.5% |
| Interquartile Range (IQR) | 8.1% | 4.5% |
| Standard Deviation (Sample) | 11.1% | 5.6% |
| Standard Deviation (Population) | 11.0% | 5.6% |
Similar Demographics by In Labor Force | Age > 16
Demographics Similar to Immigrants from Russia by In Labor Force | Age > 16
In terms of in labor force | age > 16, the demographic groups most similar to Immigrants from Russia are Immigrants from Ireland (65.3%, a difference of 0.0%), Immigrants from Armenia (65.3%, a difference of 0.010%), Panamanian (65.3%, a difference of 0.010%), Immigrants from Syria (65.3%, a difference of 0.020%), and Immigrants from South Africa (65.3%, a difference of 0.030%).
| Demographics | Rating | Rank | In Labor Force | Age > 16 |
| Immigrants | Immigrants | 81.9 /100 | #150 | Excellent 65.4% |
| Czechs | 81.5 /100 | #151 | Excellent 65.4% |
| Yugoslavians | 81.3 /100 | #152 | Excellent 65.4% |
| Immigrants | China | 80.5 /100 | #153 | Excellent 65.4% |
| Immigrants | Eastern Europe | 78.3 /100 | #154 | Good 65.4% |
| Immigrants | Armenia | 76.6 /100 | #155 | Good 65.3% |
| Immigrants | Ireland | 75.9 /100 | #156 | Good 65.3% |
| Immigrants | Russia | 75.7 /100 | #157 | Good 65.3% |
| Panamanians | 75.2 /100 | #158 | Good 65.3% |
| Immigrants | Syria | 74.6 /100 | #159 | Good 65.3% |
| Immigrants | South Africa | 73.5 /100 | #160 | Good 65.3% |
| Australians | 71.3 /100 | #161 | Good 65.3% |
| Albanians | 70.8 /100 | #162 | Good 65.3% |
| South Africans | 69.8 /100 | #163 | Good 65.3% |
| Danes | 68.8 /100 | #164 | Good 65.3% |
Demographics Similar to Immigrants from Korea by In Labor Force | Age > 16
In terms of in labor force | age > 16, the demographic groups most similar to Immigrants from Korea are Immigrants from Vietnam (66.2%, a difference of 0.0%), Burmese (66.2%, a difference of 0.010%), Taiwanese (66.2%, a difference of 0.010%), Immigrants from Singapore (66.2%, a difference of 0.010%), and Asian (66.2%, a difference of 0.030%).
| Demographics | Rating | Rank | In Labor Force | Age > 16 |
| Egyptians | 99.8 /100 | #67 | Exceptional 66.2% |
| Immigrants | Egypt | 99.7 /100 | #68 | Exceptional 66.2% |
| Sub-Saharan Africans | 99.7 /100 | #69 | Exceptional 66.2% |
| Asians | 99.7 /100 | #70 | Exceptional 66.2% |
| Burmese | 99.7 /100 | #71 | Exceptional 66.2% |
| Taiwanese | 99.7 /100 | #72 | Exceptional 66.2% |
| Immigrants | Vietnam | 99.7 /100 | #73 | Exceptional 66.2% |
| Immigrants | Korea | 99.7 /100 | #74 | Exceptional 66.2% |
| Immigrants | Singapore | 99.7 /100 | #75 | Exceptional 66.2% |
| Immigrants | Malaysia | 99.6 /100 | #76 | Exceptional 66.1% |
| Immigrants | Moldova | 99.6 /100 | #77 | Exceptional 66.1% |
| Immigrants | Asia | 99.6 /100 | #78 | Exceptional 66.1% |
| Turks | 99.6 /100 | #79 | Exceptional 66.1% |
| Malaysians | 99.6 /100 | #80 | Exceptional 66.1% |
| Moroccans | 99.5 /100 | #81 | Exceptional 66.1% |