Immigrants from Russia vs Scandinavian In Labor Force | Age > 16
COMPARE
Immigrants from Russia
Scandinavian
In Labor Force | Age > 16
In Labor Force | Age > 16 Comparison
Immigrants from Russia
Scandinavians
65.3%
IN LABOR FORCE | AGE > 16
75.7/ 100
METRIC RATING
157th/ 347
METRIC RANK
65.0%
IN LABOR FORCE | AGE > 16
33.7/ 100
METRIC RATING
191st/ 347
METRIC RANK
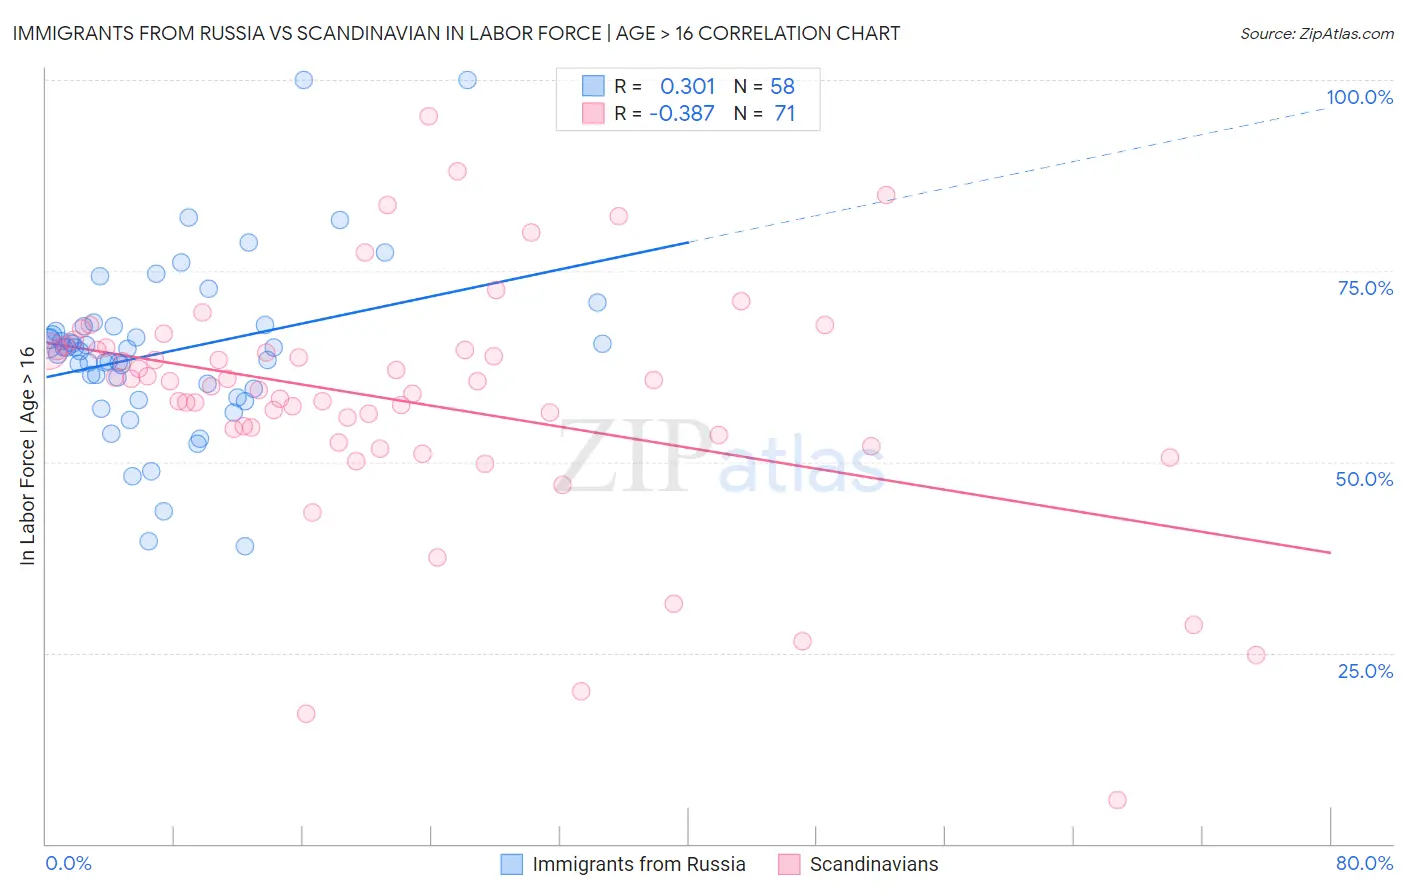
Immigrants from Russia vs Scandinavian In Labor Force | Age > 16 Correlation Chart
The statistical analysis conducted on geographies consisting of 347,958,587 people shows a mild positive correlation between the proportion of Immigrants from Russia and labor force participation rate among population ages 16 and over in the United States with a correlation coefficient (R) of 0.301 and weighted average of 65.3%. Similarly, the statistical analysis conducted on geographies consisting of 472,640,226 people shows a mild negative correlation between the proportion of Scandinavians and labor force participation rate among population ages 16 and over in the United States with a correlation coefficient (R) of -0.387 and weighted average of 65.0%, a difference of 0.51%.
In Labor Force | Age > 16 Correlation Summary
| Measurement | Immigrants from Russia | Scandinavian |
| Minimum | 38.9% | 5.7% |
| Maximum | 100.0% | 95.2% |
| Range | 61.1% | 89.5% |
| Mean | 64.5% | 58.1% |
| Median | 64.9% | 60.5% |
| Interquartile 25% (IQ1) | 59.6% | 53.6% |
| Interquartile 75% (IQ3) | 67.7% | 64.7% |
| Interquartile Range (IQR) | 8.1% | 11.1% |
| Standard Deviation (Sample) | 11.1% | 15.7% |
| Standard Deviation (Population) | 11.0% | 15.6% |
Similar Demographics by In Labor Force | Age > 16
Demographics Similar to Immigrants from Russia by In Labor Force | Age > 16
In terms of in labor force | age > 16, the demographic groups most similar to Immigrants from Russia are Immigrants from Ireland (65.3%, a difference of 0.0%), Immigrants from Armenia (65.3%, a difference of 0.010%), Panamanian (65.3%, a difference of 0.010%), Immigrants from Syria (65.3%, a difference of 0.020%), and Immigrants from South Africa (65.3%, a difference of 0.030%).
| Demographics | Rating | Rank | In Labor Force | Age > 16 |
| Immigrants | Immigrants | 81.9 /100 | #150 | Excellent 65.4% |
| Czechs | 81.5 /100 | #151 | Excellent 65.4% |
| Yugoslavians | 81.3 /100 | #152 | Excellent 65.4% |
| Immigrants | China | 80.5 /100 | #153 | Excellent 65.4% |
| Immigrants | Eastern Europe | 78.3 /100 | #154 | Good 65.4% |
| Immigrants | Armenia | 76.6 /100 | #155 | Good 65.3% |
| Immigrants | Ireland | 75.9 /100 | #156 | Good 65.3% |
| Immigrants | Russia | 75.7 /100 | #157 | Good 65.3% |
| Panamanians | 75.2 /100 | #158 | Good 65.3% |
| Immigrants | Syria | 74.6 /100 | #159 | Good 65.3% |
| Immigrants | South Africa | 73.5 /100 | #160 | Good 65.3% |
| Australians | 71.3 /100 | #161 | Good 65.3% |
| Albanians | 70.8 /100 | #162 | Good 65.3% |
| South Africans | 69.8 /100 | #163 | Good 65.3% |
| Danes | 68.8 /100 | #164 | Good 65.3% |
Demographics Similar to Scandinavians by In Labor Force | Age > 16
In terms of in labor force | age > 16, the demographic groups most similar to Scandinavians are Barbadian (65.0%, a difference of 0.0%), Immigrants from Fiji (65.0%, a difference of 0.0%), Immigrants from Europe (65.0%, a difference of 0.0%), Immigrants from Portugal (65.0%, a difference of 0.010%), and Immigrants from Greece (65.0%, a difference of 0.010%).
| Demographics | Rating | Rank | In Labor Force | Age > 16 |
| Carpatho Rusyns | 40.0 /100 | #184 | Average 65.0% |
| Syrians | 40.0 /100 | #185 | Average 65.0% |
| Immigrants | Switzerland | 38.2 /100 | #186 | Fair 65.0% |
| Immigrants | Croatia | 35.7 /100 | #187 | Fair 65.0% |
| Immigrants | Portugal | 34.8 /100 | #188 | Fair 65.0% |
| Immigrants | Greece | 34.3 /100 | #189 | Fair 65.0% |
| Barbadians | 33.9 /100 | #190 | Fair 65.0% |
| Scandinavians | 33.7 /100 | #191 | Fair 65.0% |
| Immigrants | Fiji | 33.7 /100 | #192 | Fair 65.0% |
| Immigrants | Europe | 33.6 /100 | #193 | Fair 65.0% |
| Immigrants | Southern Europe | 31.3 /100 | #194 | Fair 65.0% |
| Romanians | 31.1 /100 | #195 | Fair 65.0% |
| Haitians | 30.6 /100 | #196 | Fair 65.0% |
| Immigrants | Italy | 28.7 /100 | #197 | Fair 65.0% |
| Greeks | 26.1 /100 | #198 | Fair 64.9% |