Japanese vs Immigrants from Mexico In Labor Force | Age > 16
COMPARE
Japanese
Immigrants from Mexico
In Labor Force | Age > 16
In Labor Force | Age > 16 Comparison
Japanese
Immigrants from Mexico
65.8%
IN LABOR FORCE | AGE > 16
97.7/ 100
METRIC RATING
110th/ 347
METRIC RANK
64.3%
IN LABOR FORCE | AGE > 16
1.0/ 100
METRIC RATING
256th/ 347
METRIC RANK
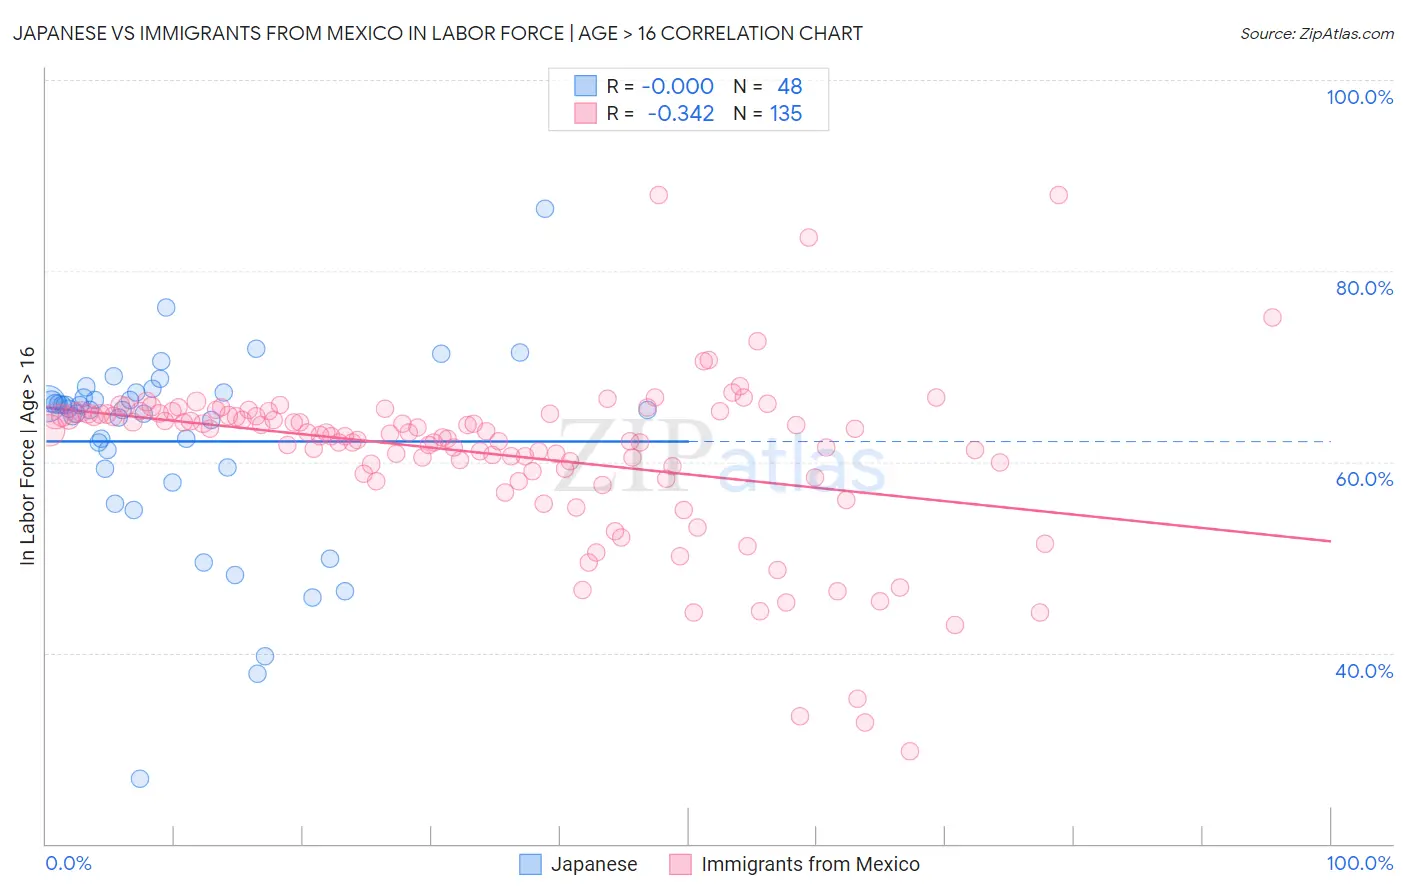
Japanese vs Immigrants from Mexico In Labor Force | Age > 16 Correlation Chart
The statistical analysis conducted on geographies consisting of 249,190,051 people shows no correlation between the proportion of Japanese and labor force participation rate among population ages 16 and over in the United States with a correlation coefficient (R) of -0.000 and weighted average of 65.8%. Similarly, the statistical analysis conducted on geographies consisting of 513,718,748 people shows a mild negative correlation between the proportion of Immigrants from Mexico and labor force participation rate among population ages 16 and over in the United States with a correlation coefficient (R) of -0.342 and weighted average of 64.3%, a difference of 2.4%.
In Labor Force | Age > 16 Correlation Summary
| Measurement | Japanese | Immigrants from Mexico |
| Minimum | 26.8% | 29.7% |
| Maximum | 86.5% | 88.0% |
| Range | 59.7% | 58.3% |
| Mean | 62.1% | 60.8% |
| Median | 65.4% | 62.9% |
| Interquartile 25% (IQ1) | 59.4% | 59.0% |
| Interquartile 75% (IQ3) | 67.0% | 65.1% |
| Interquartile Range (IQR) | 7.6% | 6.1% |
| Standard Deviation (Sample) | 10.4% | 8.7% |
| Standard Deviation (Population) | 10.3% | 8.7% |
Similar Demographics by In Labor Force | Age > 16
Demographics Similar to Japanese by In Labor Force | Age > 16
In terms of in labor force | age > 16, the demographic groups most similar to Japanese are Immigrants from Honduras (65.8%, a difference of 0.020%), Immigrants from Spain (65.8%, a difference of 0.040%), Immigrants from Japan (65.8%, a difference of 0.040%), Laotian (65.8%, a difference of 0.040%), and Immigrants from Poland (65.8%, a difference of 0.050%).
| Demographics | Rating | Rank | In Labor Force | Age > 16 |
| Immigrants | South Eastern Asia | 98.5 /100 | #103 | Exceptional 65.9% |
| Palestinians | 98.5 /100 | #104 | Exceptional 65.9% |
| Colombians | 98.4 /100 | #105 | Exceptional 65.9% |
| Immigrants | Serbia | 98.1 /100 | #106 | Exceptional 65.8% |
| Immigrants | Poland | 98.1 /100 | #107 | Exceptional 65.8% |
| Immigrants | Spain | 98.0 /100 | #108 | Exceptional 65.8% |
| Immigrants | Japan | 98.0 /100 | #109 | Exceptional 65.8% |
| Japanese | 97.7 /100 | #110 | Exceptional 65.8% |
| Immigrants | Honduras | 97.5 /100 | #111 | Exceptional 65.8% |
| Laotians | 97.4 /100 | #112 | Exceptional 65.8% |
| Pakistanis | 97.1 /100 | #113 | Exceptional 65.8% |
| Hondurans | 97.1 /100 | #114 | Exceptional 65.8% |
| Immigrants | Indonesia | 96.8 /100 | #115 | Exceptional 65.7% |
| Argentineans | 96.7 /100 | #116 | Exceptional 65.7% |
| Immigrants | Iran | 96.6 /100 | #117 | Exceptional 65.7% |
Demographics Similar to Immigrants from Mexico by In Labor Force | Age > 16
In terms of in labor force | age > 16, the demographic groups most similar to Immigrants from Mexico are Hispanic or Latino (64.3%, a difference of 0.040%), Inupiat (64.3%, a difference of 0.040%), Immigrants from Scotland (64.2%, a difference of 0.060%), Immigrants from Western Europe (64.2%, a difference of 0.090%), and Marshallese (64.2%, a difference of 0.090%).
| Demographics | Rating | Rank | In Labor Force | Age > 16 |
| Germans | 1.8 /100 | #249 | Tragic 64.4% |
| British West Indians | 1.8 /100 | #250 | Tragic 64.4% |
| Portuguese | 1.6 /100 | #251 | Tragic 64.4% |
| Immigrants | Dominican Republic | 1.5 /100 | #252 | Tragic 64.4% |
| Czechoslovakians | 1.4 /100 | #253 | Tragic 64.3% |
| Immigrants | Uzbekistan | 1.4 /100 | #254 | Tragic 64.3% |
| Hispanics or Latinos | 1.1 /100 | #255 | Tragic 64.3% |
| Immigrants | Mexico | 1.0 /100 | #256 | Tragic 64.3% |
| Inupiat | 0.8 /100 | #257 | Tragic 64.3% |
| Immigrants | Scotland | 0.8 /100 | #258 | Tragic 64.2% |
| Immigrants | Western Europe | 0.7 /100 | #259 | Tragic 64.2% |
| Marshallese | 0.7 /100 | #260 | Tragic 64.2% |
| Basques | 0.7 /100 | #261 | Tragic 64.2% |
| Finns | 0.7 /100 | #262 | Tragic 64.2% |
| Bahamians | 0.6 /100 | #263 | Tragic 64.2% |