Immigrants from Russia vs Bolivian In Labor Force | Age > 16
COMPARE
Immigrants from Russia
Bolivian
In Labor Force | Age > 16
In Labor Force | Age > 16 Comparison
Immigrants from Russia
Bolivians
65.3%
IN LABOR FORCE | AGE > 16
75.7/ 100
METRIC RATING
157th/ 347
METRIC RANK
68.2%
IN LABOR FORCE | AGE > 16
100.0/ 100
METRIC RATING
11th/ 347
METRIC RANK
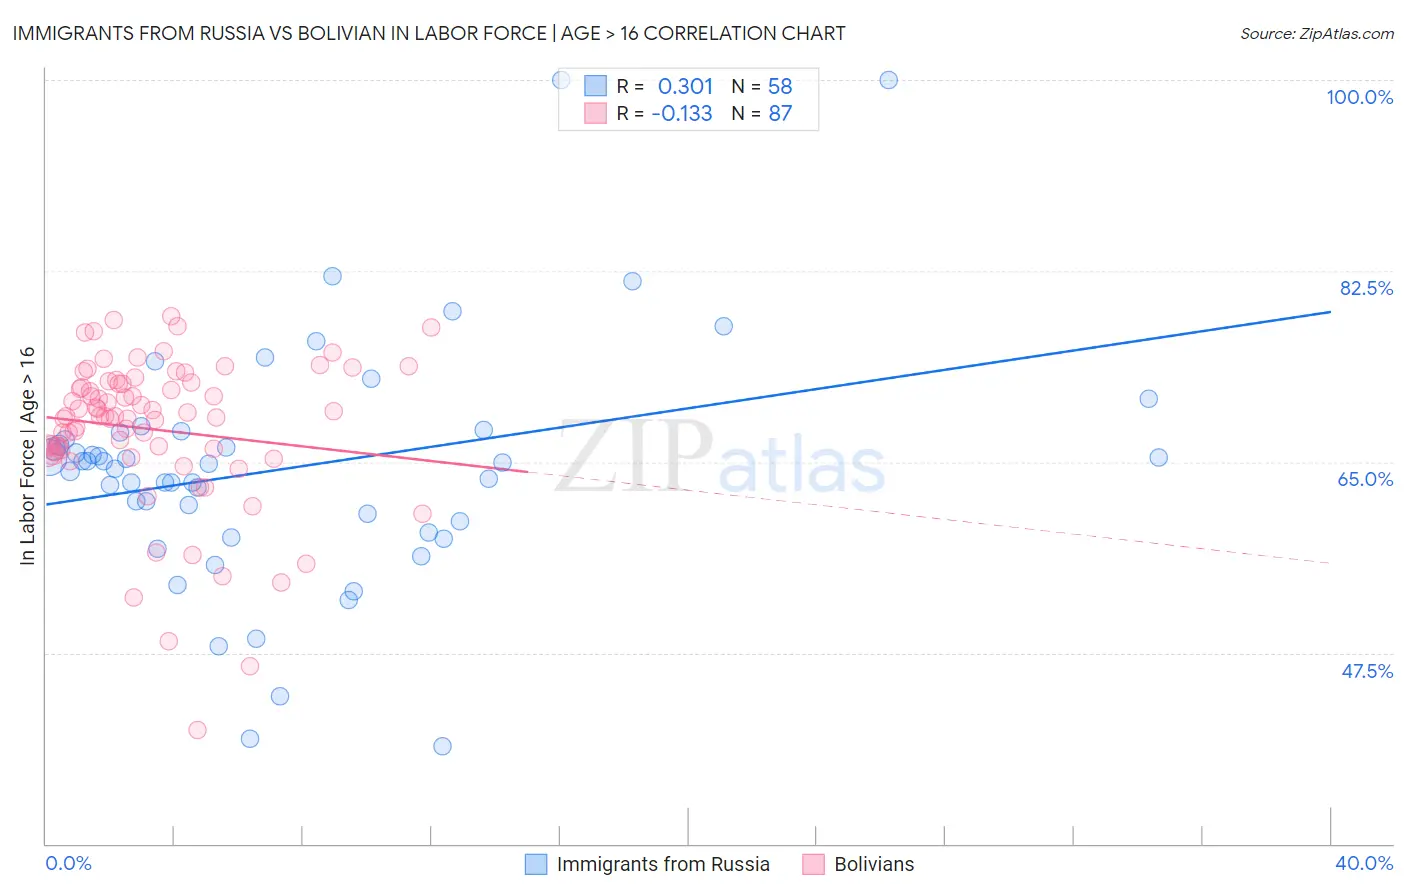
Immigrants from Russia vs Bolivian In Labor Force | Age > 16 Correlation Chart
The statistical analysis conducted on geographies consisting of 347,958,587 people shows a mild positive correlation between the proportion of Immigrants from Russia and labor force participation rate among population ages 16 and over in the United States with a correlation coefficient (R) of 0.301 and weighted average of 65.3%. Similarly, the statistical analysis conducted on geographies consisting of 184,675,621 people shows a poor negative correlation between the proportion of Bolivians and labor force participation rate among population ages 16 and over in the United States with a correlation coefficient (R) of -0.133 and weighted average of 68.2%, a difference of 4.4%.
In Labor Force | Age > 16 Correlation Summary
| Measurement | Immigrants from Russia | Bolivian |
| Minimum | 38.9% | 40.4% |
| Maximum | 100.0% | 78.4% |
| Range | 61.1% | 38.0% |
| Mean | 64.5% | 68.0% |
| Median | 64.9% | 69.2% |
| Interquartile 25% (IQ1) | 59.6% | 65.9% |
| Interquartile 75% (IQ3) | 67.7% | 72.3% |
| Interquartile Range (IQR) | 8.1% | 6.4% |
| Standard Deviation (Sample) | 11.1% | 7.0% |
| Standard Deviation (Population) | 11.0% | 6.9% |
Similar Demographics by In Labor Force | Age > 16
Demographics Similar to Immigrants from Russia by In Labor Force | Age > 16
In terms of in labor force | age > 16, the demographic groups most similar to Immigrants from Russia are Immigrants from Ireland (65.3%, a difference of 0.0%), Immigrants from Armenia (65.3%, a difference of 0.010%), Panamanian (65.3%, a difference of 0.010%), Immigrants from Syria (65.3%, a difference of 0.020%), and Immigrants from South Africa (65.3%, a difference of 0.030%).
| Demographics | Rating | Rank | In Labor Force | Age > 16 |
| Immigrants | Immigrants | 81.9 /100 | #150 | Excellent 65.4% |
| Czechs | 81.5 /100 | #151 | Excellent 65.4% |
| Yugoslavians | 81.3 /100 | #152 | Excellent 65.4% |
| Immigrants | China | 80.5 /100 | #153 | Excellent 65.4% |
| Immigrants | Eastern Europe | 78.3 /100 | #154 | Good 65.4% |
| Immigrants | Armenia | 76.6 /100 | #155 | Good 65.3% |
| Immigrants | Ireland | 75.9 /100 | #156 | Good 65.3% |
| Immigrants | Russia | 75.7 /100 | #157 | Good 65.3% |
| Panamanians | 75.2 /100 | #158 | Good 65.3% |
| Immigrants | Syria | 74.6 /100 | #159 | Good 65.3% |
| Immigrants | South Africa | 73.5 /100 | #160 | Good 65.3% |
| Australians | 71.3 /100 | #161 | Good 65.3% |
| Albanians | 70.8 /100 | #162 | Good 65.3% |
| South Africans | 69.8 /100 | #163 | Good 65.3% |
| Danes | 68.8 /100 | #164 | Good 65.3% |
Demographics Similar to Bolivians by In Labor Force | Age > 16
In terms of in labor force | age > 16, the demographic groups most similar to Bolivians are Sudanese (68.0%, a difference of 0.22%), Immigrants from Nepal (68.0%, a difference of 0.24%), Immigrants from Bolivia (68.4%, a difference of 0.37%), Immigrants from Eastern Africa (68.5%, a difference of 0.40%), and Immigrants from Sierra Leone (68.5%, a difference of 0.41%).
| Demographics | Rating | Rank | In Labor Force | Age > 16 |
| Immigrants | Somalia | 100.0 /100 | #4 | Exceptional 69.1% |
| Sierra Leoneans | 100.0 /100 | #5 | Exceptional 68.9% |
| Immigrants | Eritrea | 100.0 /100 | #6 | Exceptional 68.9% |
| Immigrants | Cameroon | 100.0 /100 | #7 | Exceptional 68.7% |
| Immigrants | Sierra Leone | 100.0 /100 | #8 | Exceptional 68.5% |
| Immigrants | Eastern Africa | 100.0 /100 | #9 | Exceptional 68.5% |
| Immigrants | Bolivia | 100.0 /100 | #10 | Exceptional 68.4% |
| Bolivians | 100.0 /100 | #11 | Exceptional 68.2% |
| Sudanese | 100.0 /100 | #12 | Exceptional 68.0% |
| Immigrants | Nepal | 100.0 /100 | #13 | Exceptional 68.0% |
| Liberians | 100.0 /100 | #14 | Exceptional 67.8% |
| Immigrants | Middle Africa | 100.0 /100 | #15 | Exceptional 67.7% |
| Immigrants | Sudan | 100.0 /100 | #16 | Exceptional 67.7% |
| Immigrants | India | 100.0 /100 | #17 | Exceptional 67.6% |
| Immigrants | Liberia | 100.0 /100 | #18 | Exceptional 67.6% |