Greek vs Osage In Labor Force | Age 20-24
COMPARE
Greek
Osage
In Labor Force | Age 20-24
In Labor Force | Age 20-24 Comparison
Greeks
Osage
76.0%
IN LABOR FORCE | AGE 20-24
96.9/ 100
METRIC RATING
107th/ 347
METRIC RANK
75.3%
IN LABOR FORCE | AGE 20-24
72.3/ 100
METRIC RATING
154th/ 347
METRIC RANK
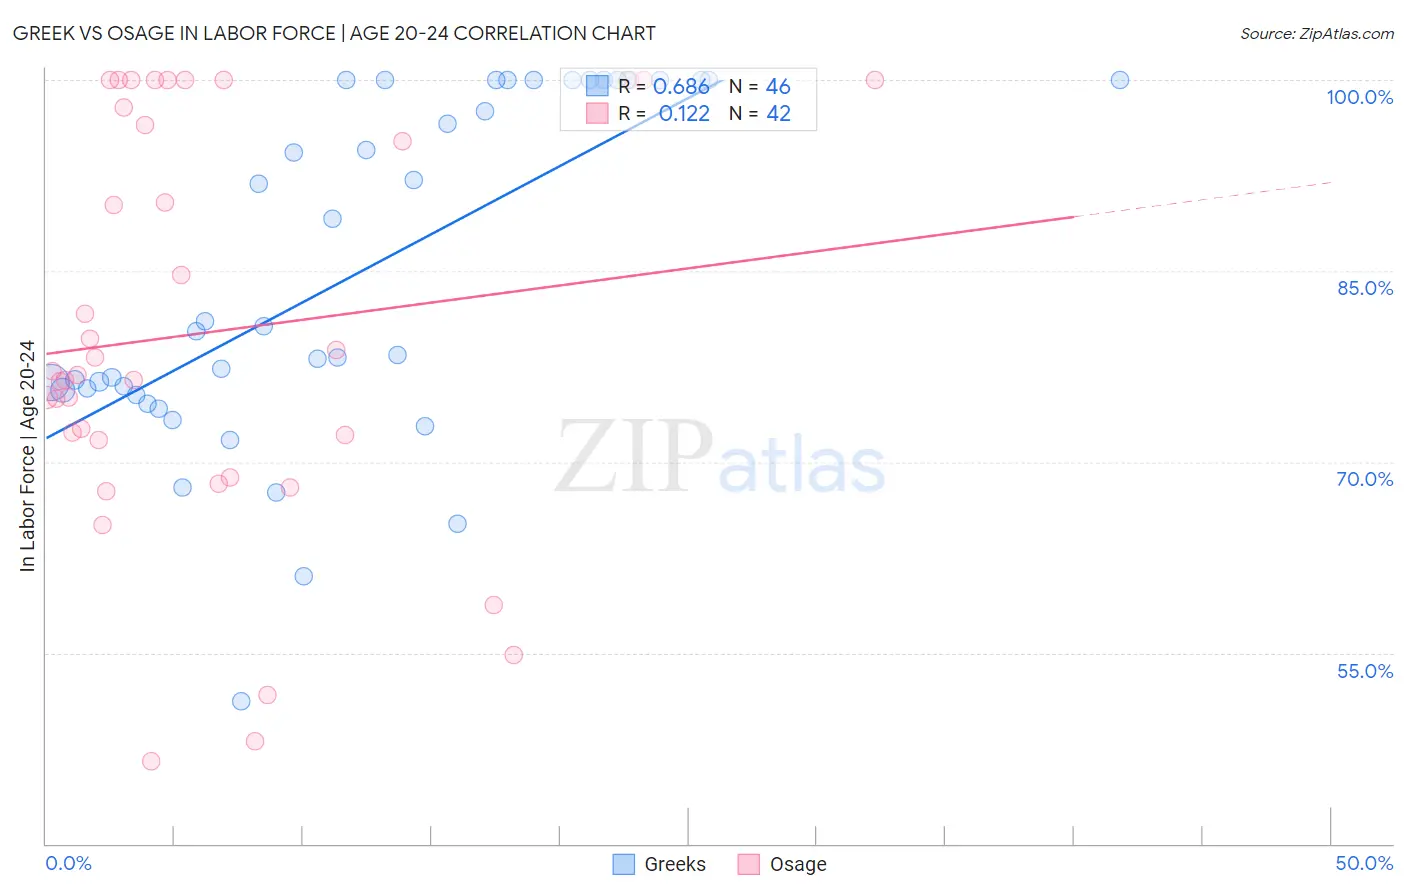
Greek vs Osage In Labor Force | Age 20-24 Correlation Chart
The statistical analysis conducted on geographies consisting of 482,371,650 people shows a significant positive correlation between the proportion of Greeks and labor force participation rate among population between the ages 20 and 24 in the United States with a correlation coefficient (R) of 0.686 and weighted average of 76.0%. Similarly, the statistical analysis conducted on geographies consisting of 91,790,564 people shows a poor positive correlation between the proportion of Osage and labor force participation rate among population between the ages 20 and 24 in the United States with a correlation coefficient (R) of 0.122 and weighted average of 75.3%, a difference of 0.91%.
In Labor Force | Age 20-24 Correlation Summary
| Measurement | Greek | Osage |
| Minimum | 51.2% | 46.5% |
| Maximum | 100.0% | 100.0% |
| Range | 48.8% | 53.5% |
| Mean | 84.7% | 80.2% |
| Median | 80.5% | 77.0% |
| Interquartile 25% (IQ1) | 75.6% | 71.7% |
| Interquartile 75% (IQ3) | 100.0% | 97.9% |
| Interquartile Range (IQR) | 24.4% | 26.2% |
| Standard Deviation (Sample) | 13.4% | 15.8% |
| Standard Deviation (Population) | 13.2% | 15.6% |
Similar Demographics by In Labor Force | Age 20-24
Demographics Similar to Greeks by In Labor Force | Age 20-24
In terms of in labor force | age 20-24, the demographic groups most similar to Greeks are Immigrants from Uganda (76.0%, a difference of 0.030%), Iraqi (76.0%, a difference of 0.030%), Macedonian (76.0%, a difference of 0.040%), Immigrants from Nepal (76.0%, a difference of 0.040%), and Immigrants from North Macedonia (76.1%, a difference of 0.080%).
| Demographics | Rating | Rank | In Labor Force | Age 20-24 |
| Shoshone | 97.8 /100 | #100 | Exceptional 76.1% |
| Immigrants | Poland | 97.7 /100 | #101 | Exceptional 76.1% |
| Latvians | 97.6 /100 | #102 | Exceptional 76.1% |
| Immigrants | North Macedonia | 97.5 /100 | #103 | Exceptional 76.1% |
| Macedonians | 97.2 /100 | #104 | Exceptional 76.0% |
| Immigrants | Nepal | 97.2 /100 | #105 | Exceptional 76.0% |
| Immigrants | Uganda | 97.1 /100 | #106 | Exceptional 76.0% |
| Greeks | 96.9 /100 | #107 | Exceptional 76.0% |
| Iraqis | 96.6 /100 | #108 | Exceptional 76.0% |
| Cherokee | 95.8 /100 | #109 | Exceptional 75.9% |
| Immigrants | Morocco | 95.8 /100 | #110 | Exceptional 75.9% |
| Ukrainians | 95.7 /100 | #111 | Exceptional 75.9% |
| Immigrants | Canada | 95.6 /100 | #112 | Exceptional 75.9% |
| Immigrants | Netherlands | 95.3 /100 | #113 | Exceptional 75.9% |
| Immigrants | Zimbabwe | 95.1 /100 | #114 | Exceptional 75.9% |
Demographics Similar to Osage by In Labor Force | Age 20-24
In terms of in labor force | age 20-24, the demographic groups most similar to Osage are Guatemalan (75.3%, a difference of 0.0%), Immigrants from Guatemala (75.3%, a difference of 0.010%), Immigrants from El Salvador (75.3%, a difference of 0.010%), Immigrants from Western Europe (75.3%, a difference of 0.010%), and Lebanese (75.3%, a difference of 0.020%).
| Demographics | Rating | Rank | In Labor Force | Age 20-24 |
| Comanche | 77.6 /100 | #147 | Good 75.4% |
| Immigrants | Cambodia | 76.7 /100 | #148 | Good 75.4% |
| Ugandans | 76.1 /100 | #149 | Good 75.4% |
| Salvadorans | 74.8 /100 | #150 | Good 75.3% |
| Paiute | 74.1 /100 | #151 | Good 75.3% |
| Lebanese | 73.5 /100 | #152 | Good 75.3% |
| Guatemalans | 72.3 /100 | #153 | Good 75.3% |
| Osage | 72.3 /100 | #154 | Good 75.3% |
| Immigrants | Guatemala | 71.9 /100 | #155 | Good 75.3% |
| Immigrants | El Salvador | 71.7 /100 | #156 | Good 75.3% |
| Immigrants | Western Europe | 71.5 /100 | #157 | Good 75.3% |
| Immigrants | Bolivia | 71.0 /100 | #158 | Good 75.3% |
| South American Indians | 69.0 /100 | #159 | Good 75.3% |
| Japanese | 68.7 /100 | #160 | Good 75.3% |
| New Zealanders | 65.4 /100 | #161 | Good 75.2% |