Greek vs Immigrants from Zaire In Labor Force | Age 20-24
COMPARE
Greek
Immigrants from Zaire
In Labor Force | Age 20-24
In Labor Force | Age 20-24 Comparison
Greeks
Immigrants from Zaire
76.0%
IN LABOR FORCE | AGE 20-24
96.9/ 100
METRIC RATING
107th/ 347
METRIC RANK
76.6%
IN LABOR FORCE | AGE 20-24
99.6/ 100
METRIC RATING
79th/ 347
METRIC RANK
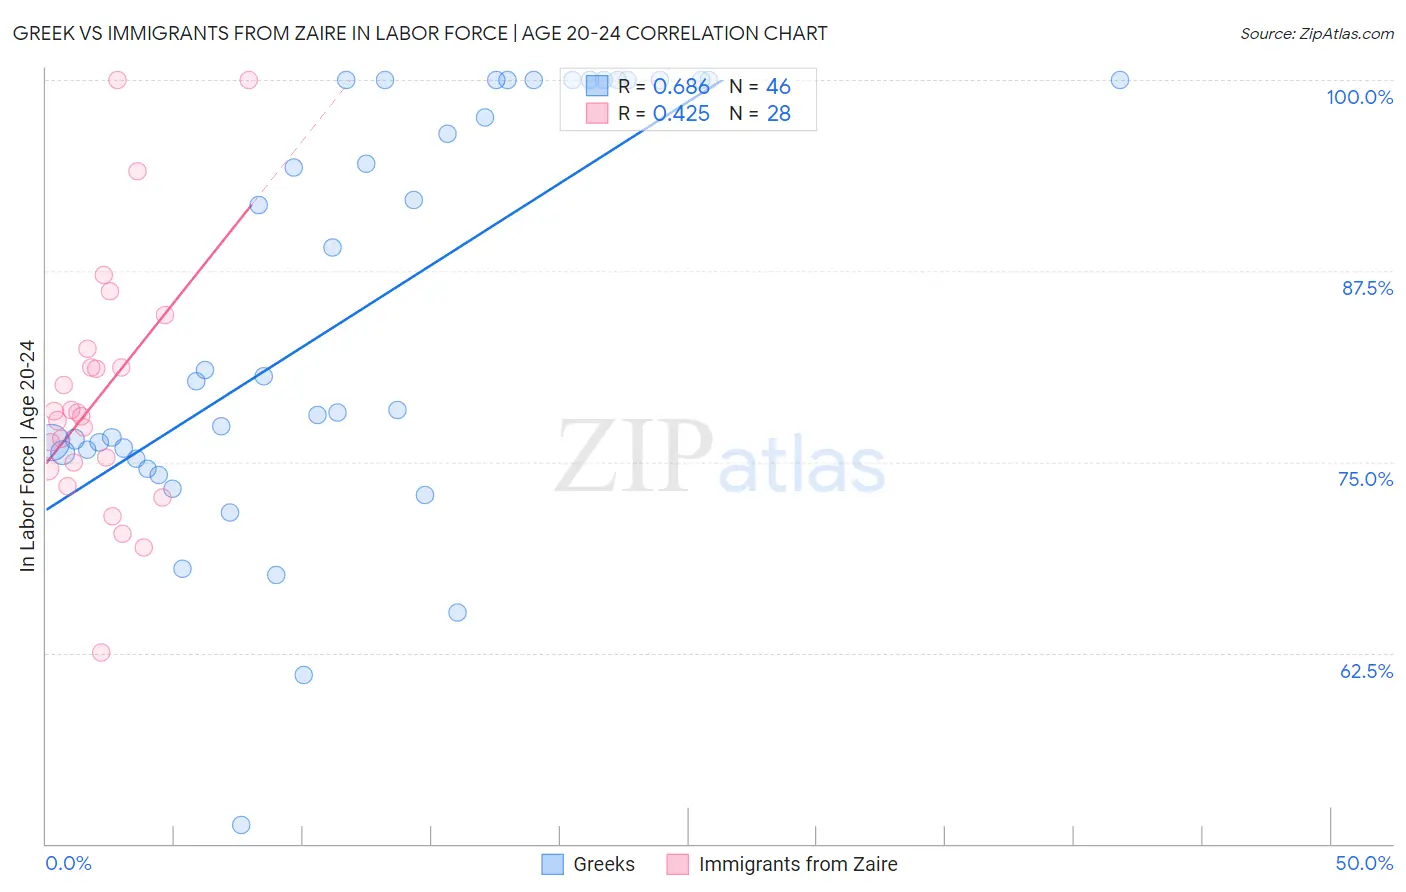
Greek vs Immigrants from Zaire In Labor Force | Age 20-24 Correlation Chart
The statistical analysis conducted on geographies consisting of 482,371,650 people shows a significant positive correlation between the proportion of Greeks and labor force participation rate among population between the ages 20 and 24 in the United States with a correlation coefficient (R) of 0.686 and weighted average of 76.0%. Similarly, the statistical analysis conducted on geographies consisting of 107,224,188 people shows a moderate positive correlation between the proportion of Immigrants from Zaire and labor force participation rate among population between the ages 20 and 24 in the United States with a correlation coefficient (R) of 0.425 and weighted average of 76.6%, a difference of 0.74%.
In Labor Force | Age 20-24 Correlation Summary
| Measurement | Greek | Immigrants from Zaire |
| Minimum | 51.2% | 62.5% |
| Maximum | 100.0% | 100.0% |
| Range | 48.8% | 37.5% |
| Mean | 84.7% | 79.4% |
| Median | 80.5% | 78.1% |
| Interquartile 25% (IQ1) | 75.6% | 74.7% |
| Interquartile 75% (IQ3) | 100.0% | 81.8% |
| Interquartile Range (IQR) | 24.4% | 7.1% |
| Standard Deviation (Sample) | 13.4% | 8.4% |
| Standard Deviation (Population) | 13.2% | 8.3% |
Similar Demographics by In Labor Force | Age 20-24
Demographics Similar to Greeks by In Labor Force | Age 20-24
In terms of in labor force | age 20-24, the demographic groups most similar to Greeks are Immigrants from Uganda (76.0%, a difference of 0.030%), Iraqi (76.0%, a difference of 0.030%), Macedonian (76.0%, a difference of 0.040%), Immigrants from Nepal (76.0%, a difference of 0.040%), and Immigrants from North Macedonia (76.1%, a difference of 0.080%).
| Demographics | Rating | Rank | In Labor Force | Age 20-24 |
| Shoshone | 97.8 /100 | #100 | Exceptional 76.1% |
| Immigrants | Poland | 97.7 /100 | #101 | Exceptional 76.1% |
| Latvians | 97.6 /100 | #102 | Exceptional 76.1% |
| Immigrants | North Macedonia | 97.5 /100 | #103 | Exceptional 76.1% |
| Macedonians | 97.2 /100 | #104 | Exceptional 76.0% |
| Immigrants | Nepal | 97.2 /100 | #105 | Exceptional 76.0% |
| Immigrants | Uganda | 97.1 /100 | #106 | Exceptional 76.0% |
| Greeks | 96.9 /100 | #107 | Exceptional 76.0% |
| Iraqis | 96.6 /100 | #108 | Exceptional 76.0% |
| Cherokee | 95.8 /100 | #109 | Exceptional 75.9% |
| Immigrants | Morocco | 95.8 /100 | #110 | Exceptional 75.9% |
| Ukrainians | 95.7 /100 | #111 | Exceptional 75.9% |
| Immigrants | Canada | 95.6 /100 | #112 | Exceptional 75.9% |
| Immigrants | Netherlands | 95.3 /100 | #113 | Exceptional 75.9% |
| Immigrants | Zimbabwe | 95.1 /100 | #114 | Exceptional 75.9% |
Demographics Similar to Immigrants from Zaire by In Labor Force | Age 20-24
In terms of in labor force | age 20-24, the demographic groups most similar to Immigrants from Zaire are Immigrants from Cameroon (76.6%, a difference of 0.020%), Canadian (76.6%, a difference of 0.020%), Italian (76.5%, a difference of 0.030%), Basque (76.5%, a difference of 0.040%), and Hmong (76.5%, a difference of 0.040%).
| Demographics | Rating | Rank | In Labor Force | Age 20-24 |
| Guamanians/Chamorros | 99.8 /100 | #72 | Exceptional 76.7% |
| British | 99.8 /100 | #73 | Exceptional 76.7% |
| Cree | 99.7 /100 | #74 | Exceptional 76.6% |
| Immigrants | Middle Africa | 99.7 /100 | #75 | Exceptional 76.6% |
| Immigrants | Moldova | 99.6 /100 | #76 | Exceptional 76.6% |
| Immigrants | Cameroon | 99.6 /100 | #77 | Exceptional 76.6% |
| Canadians | 99.6 /100 | #78 | Exceptional 76.6% |
| Immigrants | Zaire | 99.6 /100 | #79 | Exceptional 76.6% |
| Italians | 99.6 /100 | #80 | Exceptional 76.5% |
| Basques | 99.5 /100 | #81 | Exceptional 76.5% |
| Hmong | 99.5 /100 | #82 | Exceptional 76.5% |
| Carpatho Rusyns | 99.4 /100 | #83 | Exceptional 76.5% |
| Austrians | 99.4 /100 | #84 | Exceptional 76.5% |
| Portuguese | 99.3 /100 | #85 | Exceptional 76.4% |
| Immigrants | Iraq | 99.3 /100 | #86 | Exceptional 76.4% |