Immigrants from Italy vs Osage In Labor Force | Age 20-24
COMPARE
Immigrants from Italy
Osage
In Labor Force | Age 20-24
In Labor Force | Age 20-24 Comparison
Immigrants from Italy
Osage
74.6%
IN LABOR FORCE | AGE 20-24
17.6/ 100
METRIC RATING
204th/ 347
METRIC RANK
75.3%
IN LABOR FORCE | AGE 20-24
72.3/ 100
METRIC RATING
154th/ 347
METRIC RANK
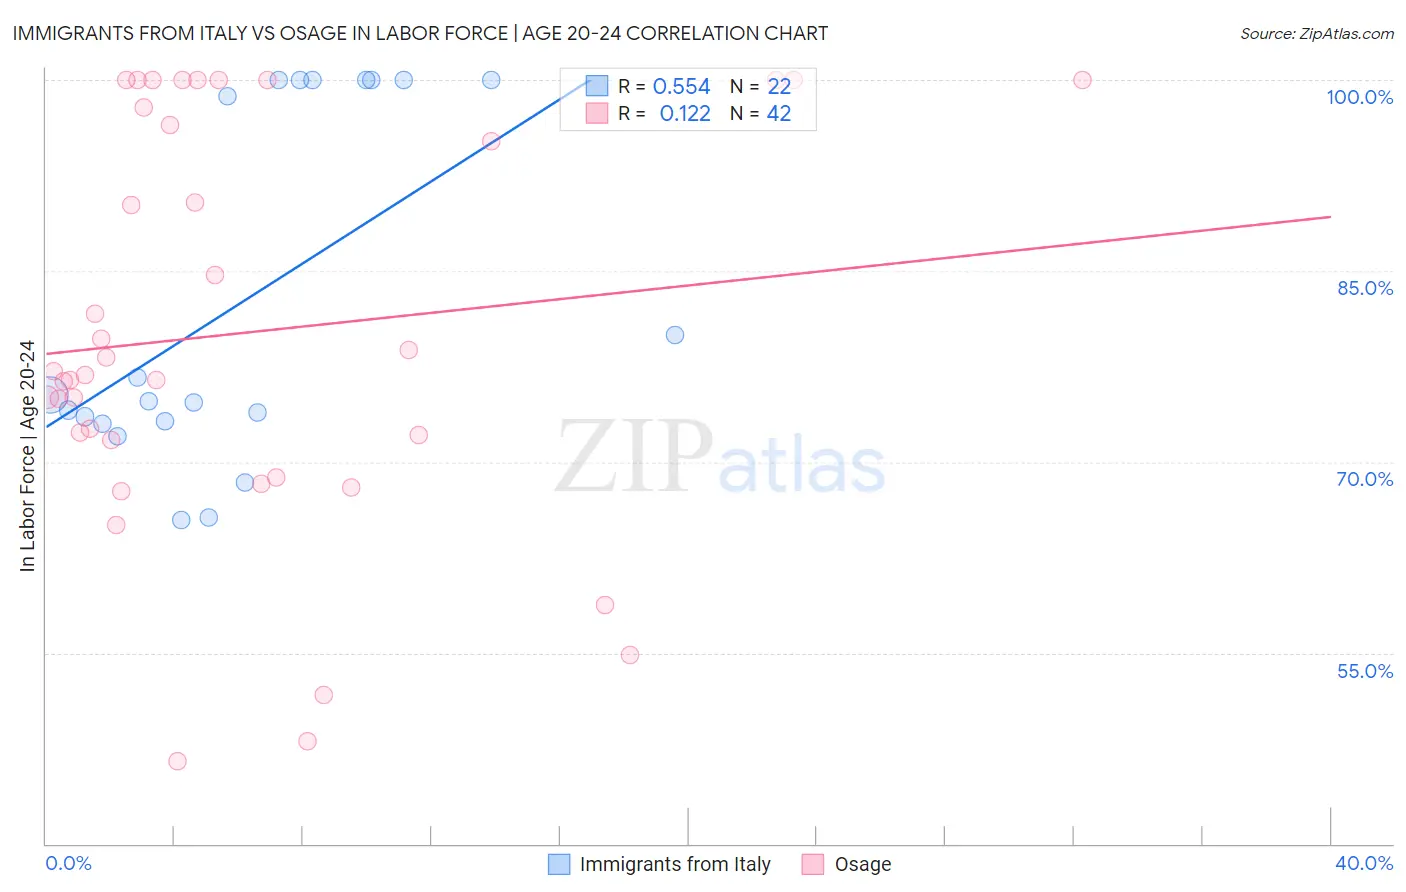
Immigrants from Italy vs Osage In Labor Force | Age 20-24 Correlation Chart
The statistical analysis conducted on geographies consisting of 324,060,092 people shows a substantial positive correlation between the proportion of Immigrants from Italy and labor force participation rate among population between the ages 20 and 24 in the United States with a correlation coefficient (R) of 0.554 and weighted average of 74.6%. Similarly, the statistical analysis conducted on geographies consisting of 91,790,564 people shows a poor positive correlation between the proportion of Osage and labor force participation rate among population between the ages 20 and 24 in the United States with a correlation coefficient (R) of 0.122 and weighted average of 75.3%, a difference of 0.92%.
In Labor Force | Age 20-24 Correlation Summary
| Measurement | Immigrants from Italy | Osage |
| Minimum | 65.4% | 46.5% |
| Maximum | 100.0% | 100.0% |
| Range | 34.6% | 53.5% |
| Mean | 82.7% | 80.2% |
| Median | 75.0% | 77.0% |
| Interquartile 25% (IQ1) | 73.2% | 71.7% |
| Interquartile 75% (IQ3) | 100.0% | 97.9% |
| Interquartile Range (IQR) | 26.8% | 26.2% |
| Standard Deviation (Sample) | 13.6% | 15.8% |
| Standard Deviation (Population) | 13.3% | 15.6% |
Similar Demographics by In Labor Force | Age 20-24
Demographics Similar to Immigrants from Italy by In Labor Force | Age 20-24
In terms of in labor force | age 20-24, the demographic groups most similar to Immigrants from Italy are Inupiat (74.6%, a difference of 0.0%), Sioux (74.6%, a difference of 0.0%), Immigrants from Northern Africa (74.6%, a difference of 0.010%), Albanian (74.6%, a difference of 0.040%), and Immigrants from Uruguay (74.6%, a difference of 0.050%).
| Demographics | Rating | Rank | In Labor Force | Age 20-24 |
| Panamanians | 25.0 /100 | #197 | Fair 74.7% |
| Immigrants | Nigeria | 24.2 /100 | #198 | Fair 74.7% |
| Taiwanese | 23.2 /100 | #199 | Fair 74.7% |
| Nigerians | 21.9 /100 | #200 | Fair 74.7% |
| Choctaw | 21.4 /100 | #201 | Fair 74.7% |
| Moroccans | 20.4 /100 | #202 | Fair 74.7% |
| Immigrants | Northern Africa | 17.9 /100 | #203 | Poor 74.6% |
| Immigrants | Italy | 17.6 /100 | #204 | Poor 74.6% |
| Inupiat | 17.6 /100 | #205 | Poor 74.6% |
| Sioux | 17.5 /100 | #206 | Poor 74.6% |
| Albanians | 16.2 /100 | #207 | Poor 74.6% |
| Immigrants | Uruguay | 15.8 /100 | #208 | Poor 74.6% |
| Arabs | 15.8 /100 | #209 | Poor 74.6% |
| Uruguayans | 15.1 /100 | #210 | Poor 74.6% |
| Immigrants | Australia | 14.7 /100 | #211 | Poor 74.6% |
Demographics Similar to Osage by In Labor Force | Age 20-24
In terms of in labor force | age 20-24, the demographic groups most similar to Osage are Guatemalan (75.3%, a difference of 0.0%), Immigrants from Guatemala (75.3%, a difference of 0.010%), Immigrants from El Salvador (75.3%, a difference of 0.010%), Immigrants from Western Europe (75.3%, a difference of 0.010%), and Lebanese (75.3%, a difference of 0.020%).
| Demographics | Rating | Rank | In Labor Force | Age 20-24 |
| Comanche | 77.6 /100 | #147 | Good 75.4% |
| Immigrants | Cambodia | 76.7 /100 | #148 | Good 75.4% |
| Ugandans | 76.1 /100 | #149 | Good 75.4% |
| Salvadorans | 74.8 /100 | #150 | Good 75.3% |
| Paiute | 74.1 /100 | #151 | Good 75.3% |
| Lebanese | 73.5 /100 | #152 | Good 75.3% |
| Guatemalans | 72.3 /100 | #153 | Good 75.3% |
| Osage | 72.3 /100 | #154 | Good 75.3% |
| Immigrants | Guatemala | 71.9 /100 | #155 | Good 75.3% |
| Immigrants | El Salvador | 71.7 /100 | #156 | Good 75.3% |
| Immigrants | Western Europe | 71.5 /100 | #157 | Good 75.3% |
| Immigrants | Bolivia | 71.0 /100 | #158 | Good 75.3% |
| South American Indians | 69.0 /100 | #159 | Good 75.3% |
| Japanese | 68.7 /100 | #160 | Good 75.3% |
| New Zealanders | 65.4 /100 | #161 | Good 75.2% |