Greek vs Cape Verdean In Labor Force | Age 20-24
COMPARE
Greek
Cape Verdean
In Labor Force | Age 20-24
In Labor Force | Age 20-24 Comparison
Greeks
Cape Verdeans
76.0%
IN LABOR FORCE | AGE 20-24
96.9/ 100
METRIC RATING
107th/ 347
METRIC RANK
78.3%
IN LABOR FORCE | AGE 20-24
100.0/ 100
METRIC RATING
17th/ 347
METRIC RANK
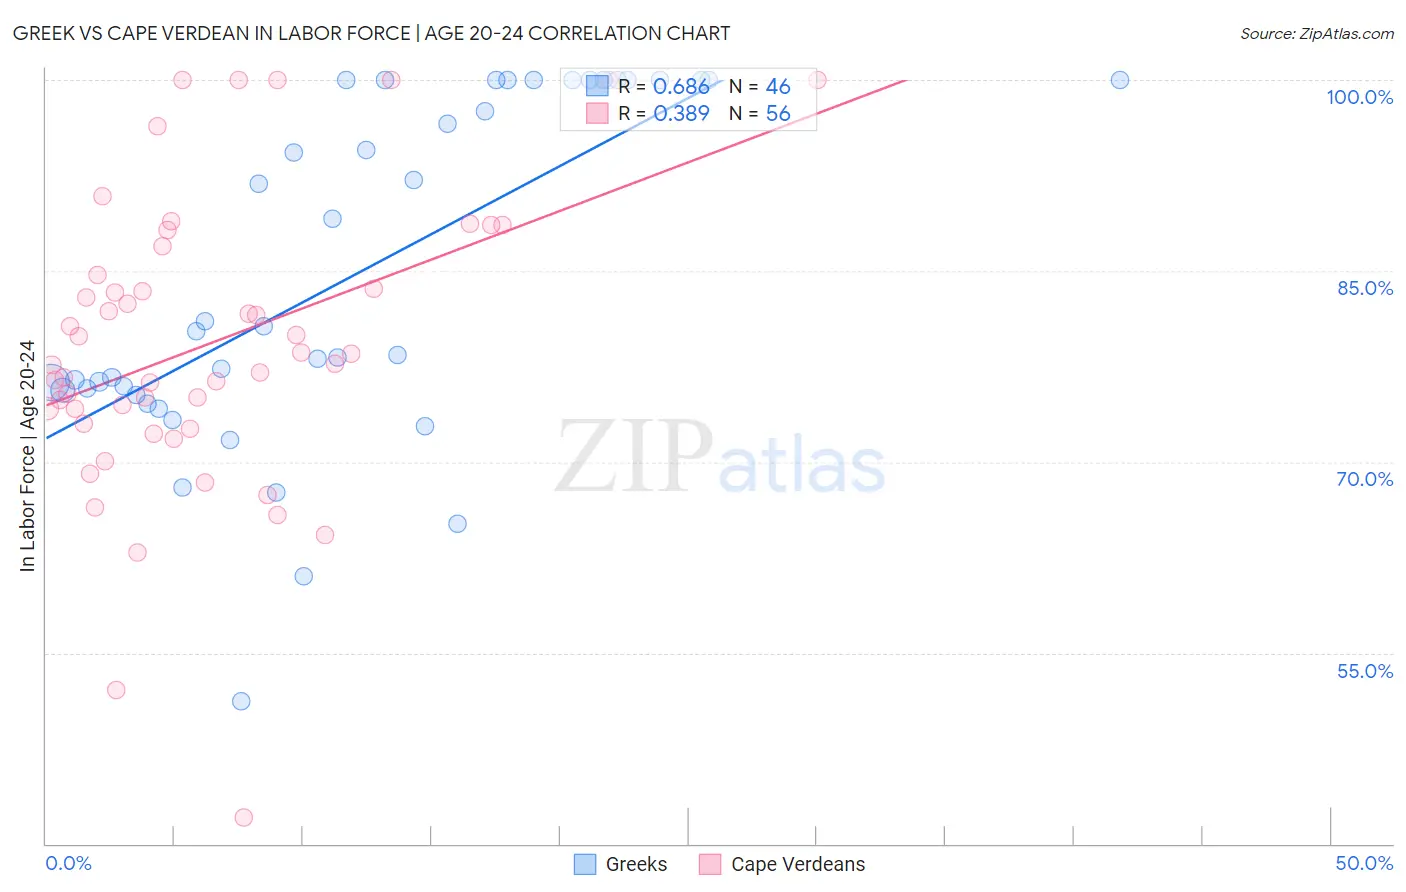
Greek vs Cape Verdean In Labor Force | Age 20-24 Correlation Chart
The statistical analysis conducted on geographies consisting of 482,371,650 people shows a significant positive correlation between the proportion of Greeks and labor force participation rate among population between the ages 20 and 24 in the United States with a correlation coefficient (R) of 0.686 and weighted average of 76.0%. Similarly, the statistical analysis conducted on geographies consisting of 107,566,363 people shows a mild positive correlation between the proportion of Cape Verdeans and labor force participation rate among population between the ages 20 and 24 in the United States with a correlation coefficient (R) of 0.389 and weighted average of 78.3%, a difference of 3.1%.
In Labor Force | Age 20-24 Correlation Summary
| Measurement | Greek | Cape Verdean |
| Minimum | 51.2% | 42.1% |
| Maximum | 100.0% | 100.0% |
| Range | 48.8% | 57.9% |
| Mean | 84.7% | 79.3% |
| Median | 80.5% | 78.1% |
| Interquartile 25% (IQ1) | 75.6% | 73.6% |
| Interquartile 75% (IQ3) | 100.0% | 85.8% |
| Interquartile Range (IQR) | 24.4% | 12.2% |
| Standard Deviation (Sample) | 13.4% | 11.6% |
| Standard Deviation (Population) | 13.2% | 11.5% |
Similar Demographics by In Labor Force | Age 20-24
Demographics Similar to Greeks by In Labor Force | Age 20-24
In terms of in labor force | age 20-24, the demographic groups most similar to Greeks are Immigrants from Uganda (76.0%, a difference of 0.030%), Iraqi (76.0%, a difference of 0.030%), Macedonian (76.0%, a difference of 0.040%), Immigrants from Nepal (76.0%, a difference of 0.040%), and Immigrants from North Macedonia (76.1%, a difference of 0.080%).
| Demographics | Rating | Rank | In Labor Force | Age 20-24 |
| Shoshone | 97.8 /100 | #100 | Exceptional 76.1% |
| Immigrants | Poland | 97.7 /100 | #101 | Exceptional 76.1% |
| Latvians | 97.6 /100 | #102 | Exceptional 76.1% |
| Immigrants | North Macedonia | 97.5 /100 | #103 | Exceptional 76.1% |
| Macedonians | 97.2 /100 | #104 | Exceptional 76.0% |
| Immigrants | Nepal | 97.2 /100 | #105 | Exceptional 76.0% |
| Immigrants | Uganda | 97.1 /100 | #106 | Exceptional 76.0% |
| Greeks | 96.9 /100 | #107 | Exceptional 76.0% |
| Iraqis | 96.6 /100 | #108 | Exceptional 76.0% |
| Cherokee | 95.8 /100 | #109 | Exceptional 75.9% |
| Immigrants | Morocco | 95.8 /100 | #110 | Exceptional 75.9% |
| Ukrainians | 95.7 /100 | #111 | Exceptional 75.9% |
| Immigrants | Canada | 95.6 /100 | #112 | Exceptional 75.9% |
| Immigrants | Netherlands | 95.3 /100 | #113 | Exceptional 75.9% |
| Immigrants | Zimbabwe | 95.1 /100 | #114 | Exceptional 75.9% |
Demographics Similar to Cape Verdeans by In Labor Force | Age 20-24
In terms of in labor force | age 20-24, the demographic groups most similar to Cape Verdeans are Dutch (78.4%, a difference of 0.040%), Sudanese (78.4%, a difference of 0.090%), Czech (78.5%, a difference of 0.22%), Scandinavian (78.5%, a difference of 0.23%), and German (78.6%, a difference of 0.30%).
| Demographics | Rating | Rank | In Labor Force | Age 20-24 |
| Slovenes | 100.0 /100 | #10 | Exceptional 78.7% |
| Finns | 100.0 /100 | #11 | Exceptional 78.7% |
| Germans | 100.0 /100 | #12 | Exceptional 78.6% |
| Scandinavians | 100.0 /100 | #13 | Exceptional 78.5% |
| Czechs | 100.0 /100 | #14 | Exceptional 78.5% |
| Sudanese | 100.0 /100 | #15 | Exceptional 78.4% |
| Dutch | 100.0 /100 | #16 | Exceptional 78.4% |
| Cape Verdeans | 100.0 /100 | #17 | Exceptional 78.3% |
| Immigrants | Bosnia and Herzegovina | 100.0 /100 | #18 | Exceptional 78.1% |
| Bangladeshis | 100.0 /100 | #19 | Exceptional 78.1% |
| French Canadians | 100.0 /100 | #20 | Exceptional 78.1% |
| Puget Sound Salish | 100.0 /100 | #21 | Exceptional 78.0% |
| Pennsylvania Germans | 100.0 /100 | #22 | Exceptional 78.0% |
| Yugoslavians | 100.0 /100 | #23 | Exceptional 78.0% |
| Liberians | 100.0 /100 | #24 | Exceptional 78.0% |