Greek vs Immigrants from Greece In Labor Force | Age 20-24
COMPARE
Greek
Immigrants from Greece
In Labor Force | Age 20-24
In Labor Force | Age 20-24 Comparison
Greeks
Immigrants from Greece
76.0%
IN LABOR FORCE | AGE 20-24
96.9/ 100
METRIC RATING
107th/ 347
METRIC RANK
74.2%
IN LABOR FORCE | AGE 20-24
4.1/ 100
METRIC RATING
231st/ 347
METRIC RANK
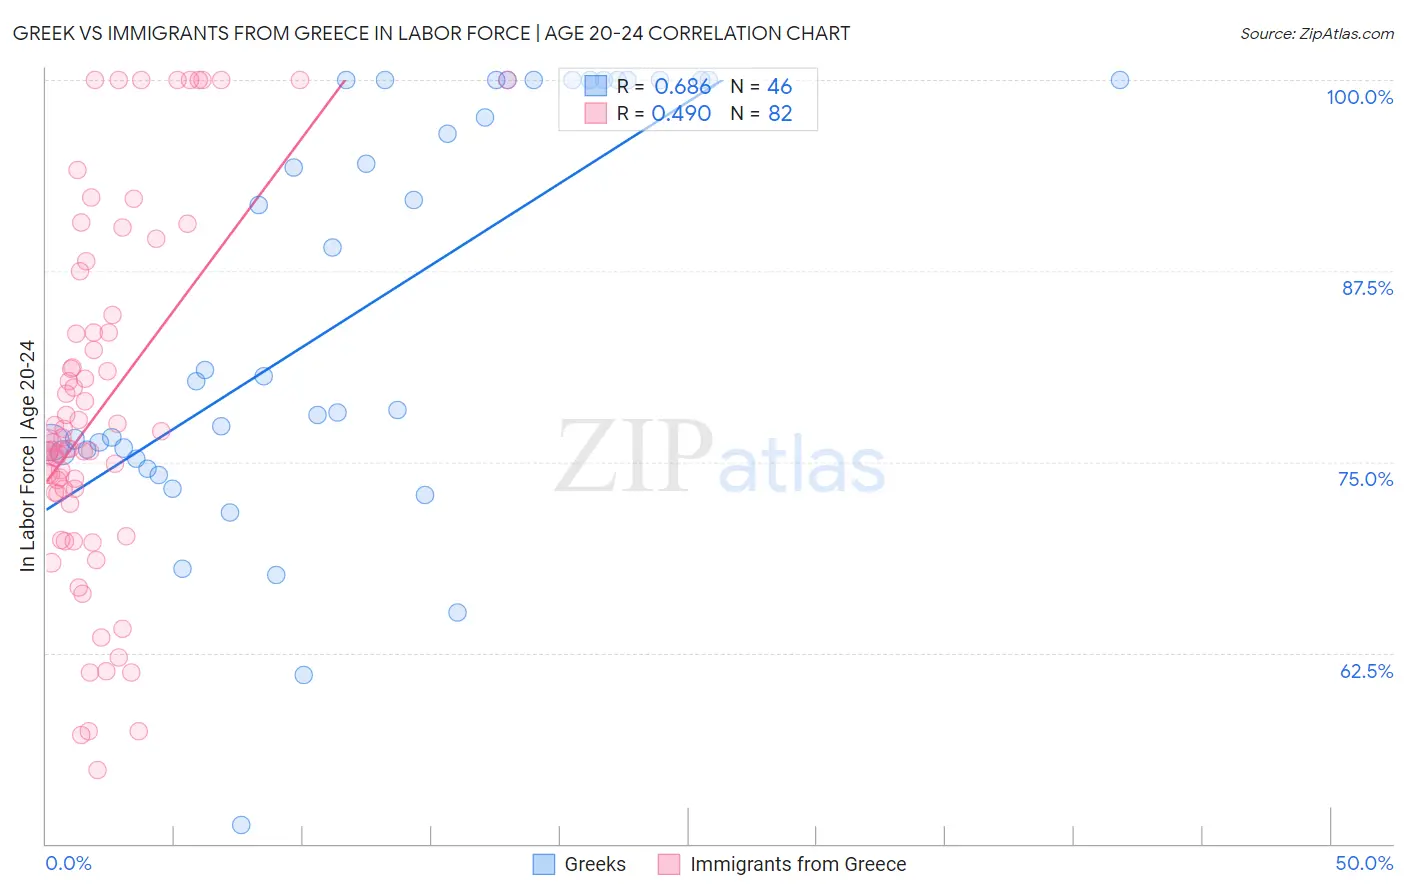
Greek vs Immigrants from Greece In Labor Force | Age 20-24 Correlation Chart
The statistical analysis conducted on geographies consisting of 482,371,650 people shows a significant positive correlation between the proportion of Greeks and labor force participation rate among population between the ages 20 and 24 in the United States with a correlation coefficient (R) of 0.686 and weighted average of 76.0%. Similarly, the statistical analysis conducted on geographies consisting of 216,782,866 people shows a moderate positive correlation between the proportion of Immigrants from Greece and labor force participation rate among population between the ages 20 and 24 in the United States with a correlation coefficient (R) of 0.490 and weighted average of 74.2%, a difference of 2.4%.
In Labor Force | Age 20-24 Correlation Summary
| Measurement | Greek | Immigrants from Greece |
| Minimum | 51.2% | 54.8% |
| Maximum | 100.0% | 100.0% |
| Range | 48.8% | 45.2% |
| Mean | 84.7% | 78.4% |
| Median | 80.5% | 76.1% |
| Interquartile 25% (IQ1) | 75.6% | 72.9% |
| Interquartile 75% (IQ3) | 100.0% | 83.5% |
| Interquartile Range (IQR) | 24.4% | 10.6% |
| Standard Deviation (Sample) | 13.4% | 11.6% |
| Standard Deviation (Population) | 13.2% | 11.5% |
Similar Demographics by In Labor Force | Age 20-24
Demographics Similar to Greeks by In Labor Force | Age 20-24
In terms of in labor force | age 20-24, the demographic groups most similar to Greeks are Immigrants from Uganda (76.0%, a difference of 0.030%), Iraqi (76.0%, a difference of 0.030%), Macedonian (76.0%, a difference of 0.040%), Immigrants from Nepal (76.0%, a difference of 0.040%), and Immigrants from North Macedonia (76.1%, a difference of 0.080%).
| Demographics | Rating | Rank | In Labor Force | Age 20-24 |
| Shoshone | 97.8 /100 | #100 | Exceptional 76.1% |
| Immigrants | Poland | 97.7 /100 | #101 | Exceptional 76.1% |
| Latvians | 97.6 /100 | #102 | Exceptional 76.1% |
| Immigrants | North Macedonia | 97.5 /100 | #103 | Exceptional 76.1% |
| Macedonians | 97.2 /100 | #104 | Exceptional 76.0% |
| Immigrants | Nepal | 97.2 /100 | #105 | Exceptional 76.0% |
| Immigrants | Uganda | 97.1 /100 | #106 | Exceptional 76.0% |
| Greeks | 96.9 /100 | #107 | Exceptional 76.0% |
| Iraqis | 96.6 /100 | #108 | Exceptional 76.0% |
| Cherokee | 95.8 /100 | #109 | Exceptional 75.9% |
| Immigrants | Morocco | 95.8 /100 | #110 | Exceptional 75.9% |
| Ukrainians | 95.7 /100 | #111 | Exceptional 75.9% |
| Immigrants | Canada | 95.6 /100 | #112 | Exceptional 75.9% |
| Immigrants | Netherlands | 95.3 /100 | #113 | Exceptional 75.9% |
| Immigrants | Zimbabwe | 95.1 /100 | #114 | Exceptional 75.9% |
Demographics Similar to Immigrants from Greece by In Labor Force | Age 20-24
In terms of in labor force | age 20-24, the demographic groups most similar to Immigrants from Greece are Immigrants from Switzerland (74.2%, a difference of 0.010%), Immigrants from Albania (74.2%, a difference of 0.020%), Immigrants from Sweden (74.2%, a difference of 0.040%), Immigrants from Chile (74.1%, a difference of 0.050%), and Immigrants (74.1%, a difference of 0.060%).
| Demographics | Rating | Rank | In Labor Force | Age 20-24 |
| Seminole | 6.9 /100 | #224 | Tragic 74.3% |
| Ghanaians | 6.2 /100 | #225 | Tragic 74.3% |
| Immigrants | Fiji | 5.9 /100 | #226 | Tragic 74.3% |
| Immigrants | Ireland | 5.8 /100 | #227 | Tragic 74.3% |
| Immigrants | Ukraine | 5.1 /100 | #228 | Tragic 74.2% |
| Immigrants | Sweden | 4.6 /100 | #229 | Tragic 74.2% |
| Immigrants | Albania | 4.3 /100 | #230 | Tragic 74.2% |
| Immigrants | Greece | 4.1 /100 | #231 | Tragic 74.2% |
| Immigrants | Switzerland | 4.1 /100 | #232 | Tragic 74.2% |
| Immigrants | Chile | 3.7 /100 | #233 | Tragic 74.1% |
| Immigrants | Immigrants | 3.6 /100 | #234 | Tragic 74.1% |
| Laotians | 3.5 /100 | #235 | Tragic 74.1% |
| Immigrants | France | 3.3 /100 | #236 | Tragic 74.1% |
| Bermudans | 3.2 /100 | #237 | Tragic 74.1% |
| Immigrants | Japan | 3.0 /100 | #238 | Tragic 74.1% |