Greek vs Subsaharan African In Labor Force | Age 20-24
COMPARE
Greek
Subsaharan African
In Labor Force | Age 20-24
In Labor Force | Age 20-24 Comparison
Greeks
Sub-Saharan Africans
76.0%
IN LABOR FORCE | AGE 20-24
96.9/ 100
METRIC RATING
107th/ 347
METRIC RANK
75.7%
IN LABOR FORCE | AGE 20-24
90.9/ 100
METRIC RATING
127th/ 347
METRIC RANK
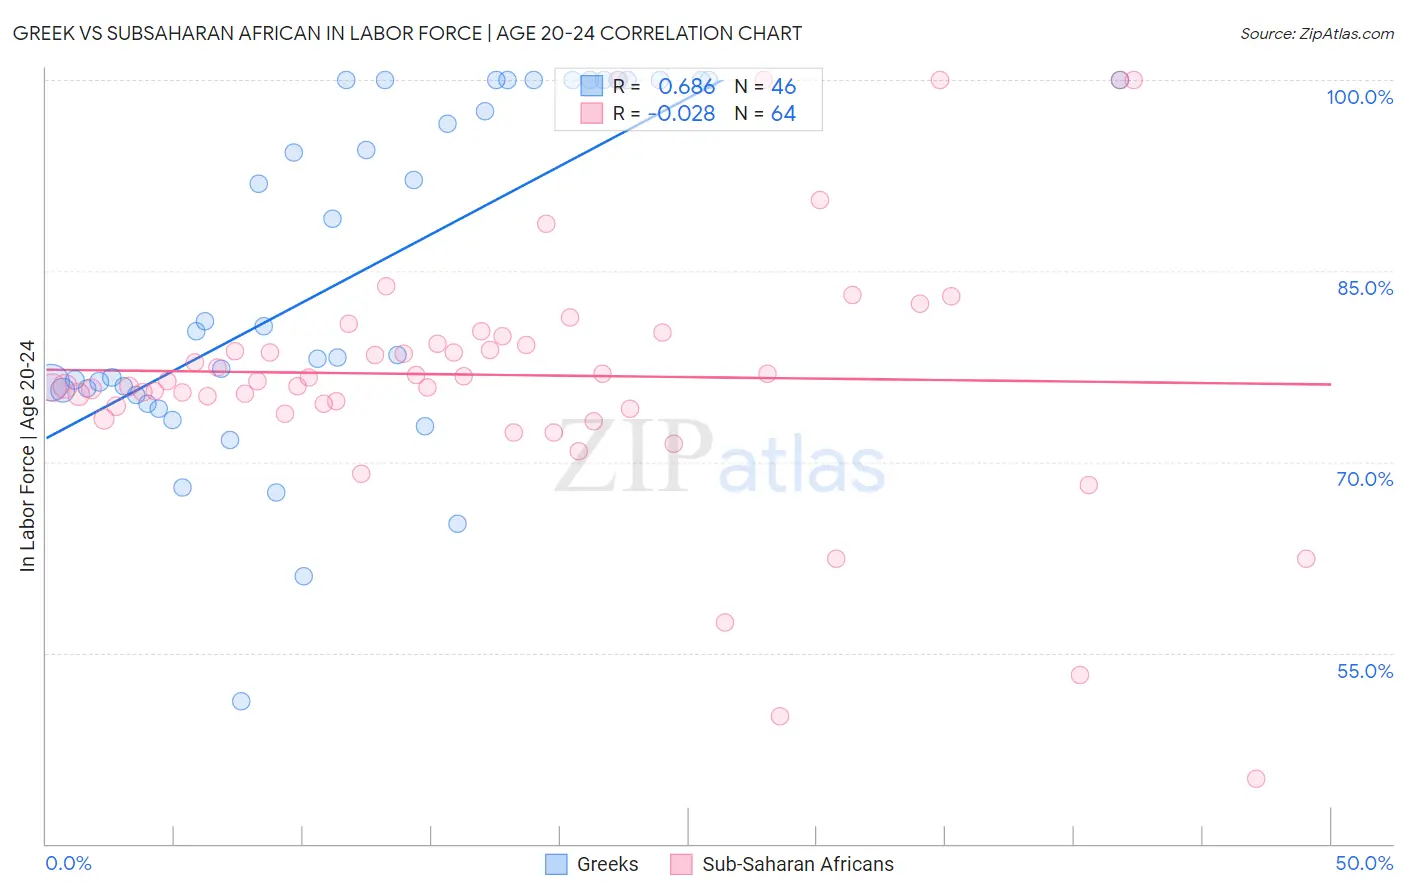
Greek vs Subsaharan African In Labor Force | Age 20-24 Correlation Chart
The statistical analysis conducted on geographies consisting of 482,371,650 people shows a significant positive correlation between the proportion of Greeks and labor force participation rate among population between the ages 20 and 24 in the United States with a correlation coefficient (R) of 0.686 and weighted average of 76.0%. Similarly, the statistical analysis conducted on geographies consisting of 507,882,166 people shows no correlation between the proportion of Sub-Saharan Africans and labor force participation rate among population between the ages 20 and 24 in the United States with a correlation coefficient (R) of -0.028 and weighted average of 75.7%, a difference of 0.42%.
In Labor Force | Age 20-24 Correlation Summary
| Measurement | Greek | Subsaharan African |
| Minimum | 51.2% | 45.1% |
| Maximum | 100.0% | 100.0% |
| Range | 48.8% | 54.9% |
| Mean | 84.7% | 76.8% |
| Median | 80.5% | 76.3% |
| Interquartile 25% (IQ1) | 75.6% | 74.3% |
| Interquartile 75% (IQ3) | 100.0% | 79.6% |
| Interquartile Range (IQR) | 24.4% | 5.3% |
| Standard Deviation (Sample) | 13.4% | 10.3% |
| Standard Deviation (Population) | 13.2% | 10.2% |
Demographics Similar to Greeks and Sub-Saharan Africans by In Labor Force | Age 20-24
In terms of in labor force | age 20-24, the demographic groups most similar to Greeks are Iraqi (76.0%, a difference of 0.030%), Cherokee (75.9%, a difference of 0.11%), Immigrants from Morocco (75.9%, a difference of 0.11%), Ukrainian (75.9%, a difference of 0.12%), and Immigrants from Canada (75.9%, a difference of 0.13%). Similarly, the demographic groups most similar to Sub-Saharan Africans are Brazilian (75.8%, a difference of 0.11%), Immigrants from Sierra Leone (75.8%, a difference of 0.15%), Immigrants from Scotland (75.8%, a difference of 0.15%), Pakistani (75.8%, a difference of 0.17%), and Immigrants from Bulgaria (75.8%, a difference of 0.17%).
| Demographics | Rating | Rank | In Labor Force | Age 20-24 |
| Greeks | 96.9 /100 | #107 | Exceptional 76.0% |
| Iraqis | 96.6 /100 | #108 | Exceptional 76.0% |
| Cherokee | 95.8 /100 | #109 | Exceptional 75.9% |
| Immigrants | Morocco | 95.8 /100 | #110 | Exceptional 75.9% |
| Ukrainians | 95.7 /100 | #111 | Exceptional 75.9% |
| Immigrants | Canada | 95.6 /100 | #112 | Exceptional 75.9% |
| Immigrants | Netherlands | 95.3 /100 | #113 | Exceptional 75.9% |
| Immigrants | Zimbabwe | 95.1 /100 | #114 | Exceptional 75.9% |
| Alaska Natives | 95.1 /100 | #115 | Exceptional 75.9% |
| Immigrants | North America | 95.0 /100 | #116 | Exceptional 75.9% |
| Assyrians/Chaldeans/Syriacs | 94.9 /100 | #117 | Exceptional 75.9% |
| Spanish Americans | 94.8 /100 | #118 | Exceptional 75.8% |
| Immigrants | Portugal | 94.8 /100 | #119 | Exceptional 75.8% |
| Immigrants | Africa | 94.6 /100 | #120 | Exceptional 75.8% |
| Immigrants | Serbia | 94.3 /100 | #121 | Exceptional 75.8% |
| Pakistanis | 94.1 /100 | #122 | Exceptional 75.8% |
| Immigrants | Bulgaria | 94.1 /100 | #123 | Exceptional 75.8% |
| Immigrants | Sierra Leone | 93.8 /100 | #124 | Exceptional 75.8% |
| Immigrants | Scotland | 93.7 /100 | #125 | Exceptional 75.8% |
| Brazilians | 93.0 /100 | #126 | Exceptional 75.8% |
| Sub-Saharan Africans | 90.9 /100 | #127 | Exceptional 75.7% |