Greek vs Osage In Labor Force | Age > 16
COMPARE
Greek
Osage
In Labor Force | Age > 16
In Labor Force | Age > 16 Comparison
Greeks
Osage
64.9%
IN LABOR FORCE | AGE > 16
26.1/ 100
METRIC RATING
198th/ 347
METRIC RANK
63.5%
IN LABOR FORCE | AGE > 16
0.0/ 100
METRIC RATING
305th/ 347
METRIC RANK
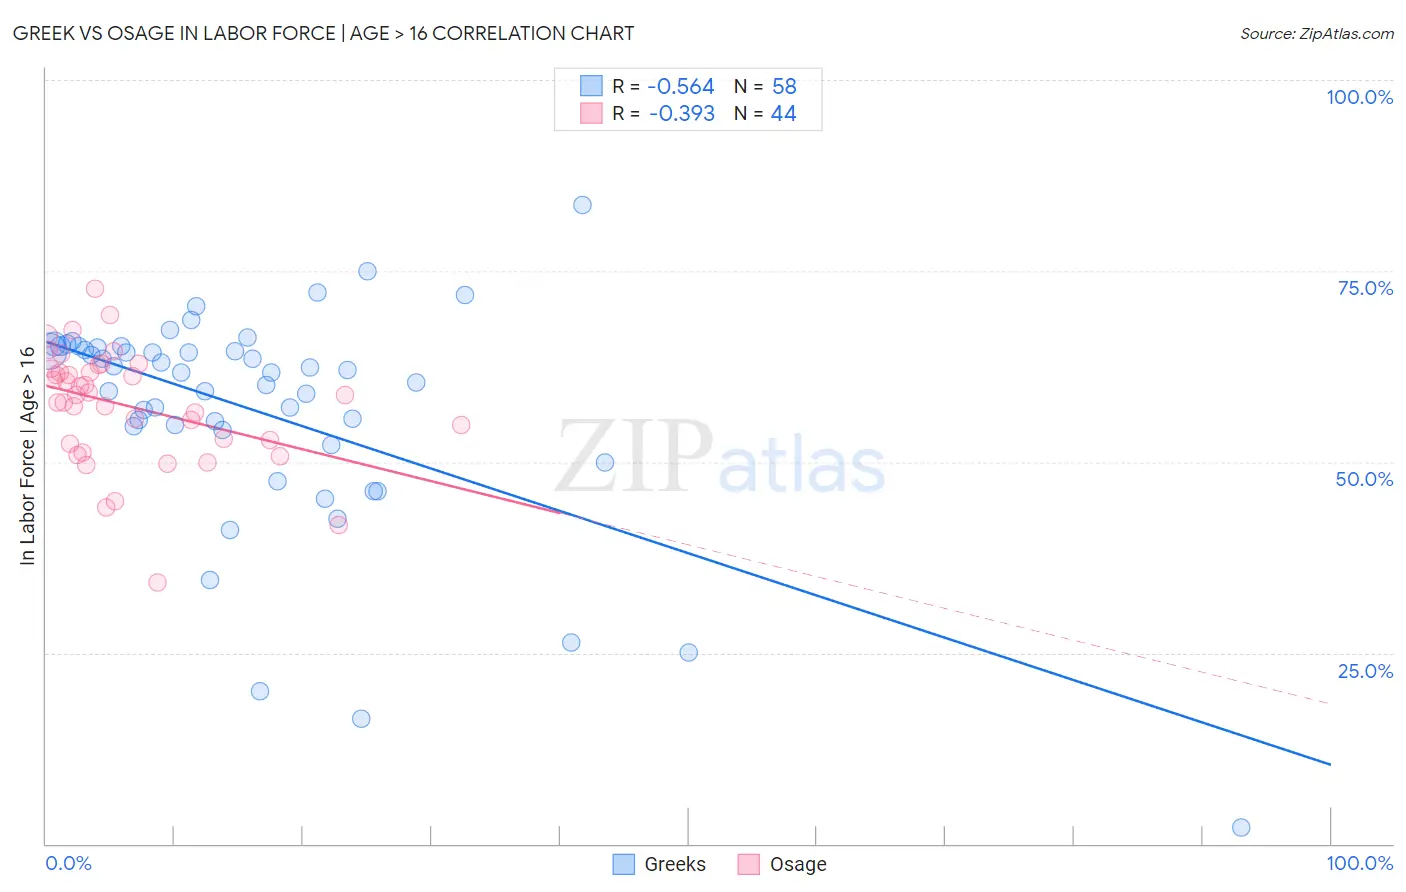
Greek vs Osage In Labor Force | Age > 16 Correlation Chart
The statistical analysis conducted on geographies consisting of 482,783,671 people shows a substantial negative correlation between the proportion of Greeks and labor force participation rate among population ages 16 and over in the United States with a correlation coefficient (R) of -0.564 and weighted average of 64.9%. Similarly, the statistical analysis conducted on geographies consisting of 91,805,602 people shows a mild negative correlation between the proportion of Osage and labor force participation rate among population ages 16 and over in the United States with a correlation coefficient (R) of -0.393 and weighted average of 63.5%, a difference of 2.3%.
In Labor Force | Age > 16 Correlation Summary
| Measurement | Greek | Osage |
| Minimum | 2.1% | 34.2% |
| Maximum | 83.6% | 72.7% |
| Range | 81.5% | 38.5% |
| Mean | 56.5% | 57.3% |
| Median | 61.7% | 58.8% |
| Interquartile 25% (IQ1) | 54.1% | 52.6% |
| Interquartile 75% (IQ3) | 65.0% | 62.0% |
| Interquartile Range (IQR) | 10.9% | 9.4% |
| Standard Deviation (Sample) | 14.9% | 7.5% |
| Standard Deviation (Population) | 14.8% | 7.4% |
Similar Demographics by In Labor Force | Age > 16
Demographics Similar to Greeks by In Labor Force | Age > 16
In terms of in labor force | age > 16, the demographic groups most similar to Greeks are Immigrants from Italy (65.0%, a difference of 0.040%), Mexican American Indian (64.9%, a difference of 0.050%), Haitian (65.0%, a difference of 0.060%), Immigrants from Southern Europe (65.0%, a difference of 0.070%), and Romanian (65.0%, a difference of 0.070%).
| Demographics | Rating | Rank | In Labor Force | Age > 16 |
| Scandinavians | 33.7 /100 | #191 | Fair 65.0% |
| Immigrants | Fiji | 33.7 /100 | #192 | Fair 65.0% |
| Immigrants | Europe | 33.6 /100 | #193 | Fair 65.0% |
| Immigrants | Southern Europe | 31.3 /100 | #194 | Fair 65.0% |
| Romanians | 31.1 /100 | #195 | Fair 65.0% |
| Haitians | 30.6 /100 | #196 | Fair 65.0% |
| Immigrants | Italy | 28.7 /100 | #197 | Fair 65.0% |
| Greeks | 26.1 /100 | #198 | Fair 64.9% |
| Mexican American Indians | 23.1 /100 | #199 | Fair 64.9% |
| Armenians | 20.2 /100 | #200 | Fair 64.9% |
| Ukrainians | 19.6 /100 | #201 | Poor 64.9% |
| Immigrants | Belgium | 19.4 /100 | #202 | Poor 64.9% |
| Russians | 18.8 /100 | #203 | Poor 64.9% |
| Slovenes | 18.7 /100 | #204 | Poor 64.9% |
| Jamaicans | 18.7 /100 | #205 | Poor 64.9% |
Demographics Similar to Osage by In Labor Force | Age > 16
In terms of in labor force | age > 16, the demographic groups most similar to Osage are Nonimmigrants (63.5%, a difference of 0.050%), Black/African American (63.4%, a difference of 0.090%), Cree (63.5%, a difference of 0.10%), Central American Indian (63.4%, a difference of 0.13%), and Delaware (63.6%, a difference of 0.14%).
| Demographics | Rating | Rank | In Labor Force | Age > 16 |
| Comanche | 0.0 /100 | #298 | Tragic 63.6% |
| Whites/Caucasians | 0.0 /100 | #299 | Tragic 63.6% |
| Immigrants | Azores | 0.0 /100 | #300 | Tragic 63.6% |
| Spanish Americans | 0.0 /100 | #301 | Tragic 63.6% |
| Delaware | 0.0 /100 | #302 | Tragic 63.6% |
| Cree | 0.0 /100 | #303 | Tragic 63.5% |
| Immigrants | Nonimmigrants | 0.0 /100 | #304 | Tragic 63.5% |
| Osage | 0.0 /100 | #305 | Tragic 63.5% |
| Blacks/African Americans | 0.0 /100 | #306 | Tragic 63.4% |
| Central American Indians | 0.0 /100 | #307 | Tragic 63.4% |
| Pennsylvania Germans | 0.0 /100 | #308 | Tragic 63.4% |
| Scotch-Irish | 0.0 /100 | #309 | Tragic 63.3% |
| Shoshone | 0.0 /100 | #310 | Tragic 63.2% |
| Blackfeet | 0.0 /100 | #311 | Tragic 63.2% |
| Iroquois | 0.0 /100 | #312 | Tragic 63.2% |