Immigrants from Yemen vs Osage In Labor Force | Age 20-24
COMPARE
Immigrants from Yemen
Osage
In Labor Force | Age 20-24
In Labor Force | Age 20-24 Comparison
Immigrants from Yemen
Osage
68.9%
IN LABOR FORCE | AGE 20-24
0.0/ 100
METRIC RATING
339th/ 347
METRIC RANK
75.3%
IN LABOR FORCE | AGE 20-24
72.3/ 100
METRIC RATING
154th/ 347
METRIC RANK
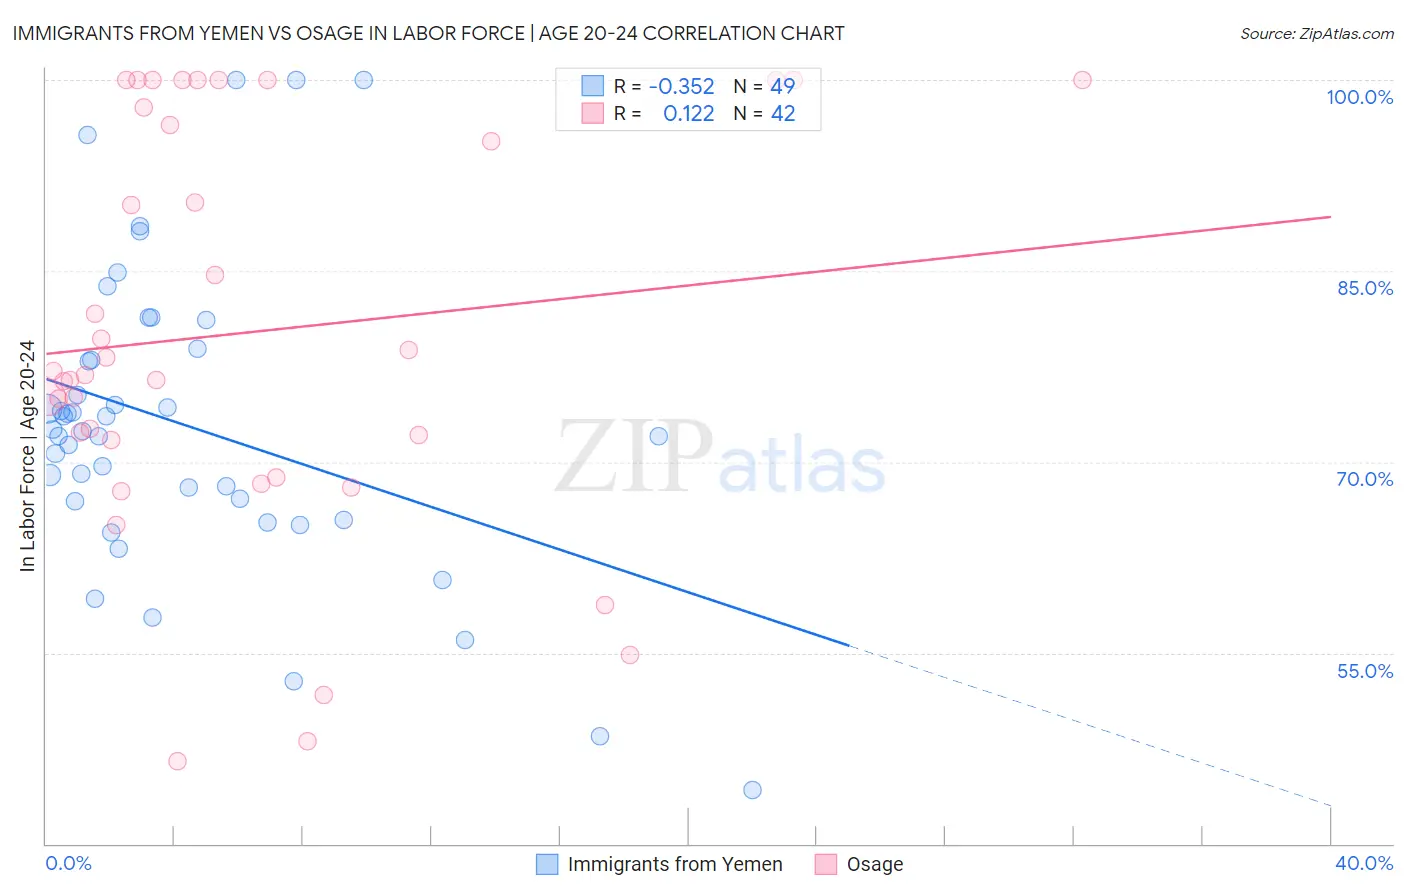
Immigrants from Yemen vs Osage In Labor Force | Age 20-24 Correlation Chart
The statistical analysis conducted on geographies consisting of 82,430,523 people shows a mild negative correlation between the proportion of Immigrants from Yemen and labor force participation rate among population between the ages 20 and 24 in the United States with a correlation coefficient (R) of -0.352 and weighted average of 68.9%. Similarly, the statistical analysis conducted on geographies consisting of 91,790,564 people shows a poor positive correlation between the proportion of Osage and labor force participation rate among population between the ages 20 and 24 in the United States with a correlation coefficient (R) of 0.122 and weighted average of 75.3%, a difference of 9.3%.
In Labor Force | Age 20-24 Correlation Summary
| Measurement | Immigrants from Yemen | Osage |
| Minimum | 44.2% | 46.5% |
| Maximum | 100.0% | 100.0% |
| Range | 55.8% | 53.5% |
| Mean | 72.9% | 80.2% |
| Median | 72.4% | 77.0% |
| Interquartile 25% (IQ1) | 66.2% | 71.7% |
| Interquartile 75% (IQ3) | 78.4% | 97.9% |
| Interquartile Range (IQR) | 12.3% | 26.2% |
| Standard Deviation (Sample) | 12.0% | 15.8% |
| Standard Deviation (Population) | 11.9% | 15.6% |
Similar Demographics by In Labor Force | Age 20-24
Demographics Similar to Immigrants from Yemen by In Labor Force | Age 20-24
In terms of in labor force | age 20-24, the demographic groups most similar to Immigrants from Yemen are Pima (69.0%, a difference of 0.13%), Menominee (68.7%, a difference of 0.31%), Guyanese (69.2%, a difference of 0.39%), Tohono O'odham (68.6%, a difference of 0.44%), and Immigrants from Guyana (69.3%, a difference of 0.52%).
| Demographics | Rating | Rank | In Labor Force | Age 20-24 |
| Immigrants | Uzbekistan | 0.0 /100 | #332 | Tragic 70.4% |
| Yuman | 0.0 /100 | #333 | Tragic 70.3% |
| British West Indians | 0.0 /100 | #334 | Tragic 70.0% |
| Immigrants | Barbados | 0.0 /100 | #335 | Tragic 69.7% |
| Immigrants | Guyana | 0.0 /100 | #336 | Tragic 69.3% |
| Guyanese | 0.0 /100 | #337 | Tragic 69.2% |
| Pima | 0.0 /100 | #338 | Tragic 69.0% |
| Immigrants | Yemen | 0.0 /100 | #339 | Tragic 68.9% |
| Menominee | 0.0 /100 | #340 | Tragic 68.7% |
| Tohono O'odham | 0.0 /100 | #341 | Tragic 68.6% |
| Immigrants | St. Vincent and the Grenadines | 0.0 /100 | #342 | Tragic 68.4% |
| Puerto Ricans | 0.0 /100 | #343 | Tragic 68.3% |
| Immigrants | Grenada | 0.0 /100 | #344 | Tragic 67.2% |
| Hopi | 0.0 /100 | #345 | Tragic 66.0% |
| Lumbee | 0.0 /100 | #346 | Tragic 65.5% |
Demographics Similar to Osage by In Labor Force | Age 20-24
In terms of in labor force | age 20-24, the demographic groups most similar to Osage are Guatemalan (75.3%, a difference of 0.0%), Immigrants from Guatemala (75.3%, a difference of 0.010%), Immigrants from El Salvador (75.3%, a difference of 0.010%), Immigrants from Western Europe (75.3%, a difference of 0.010%), and Lebanese (75.3%, a difference of 0.020%).
| Demographics | Rating | Rank | In Labor Force | Age 20-24 |
| Comanche | 77.6 /100 | #147 | Good 75.4% |
| Immigrants | Cambodia | 76.7 /100 | #148 | Good 75.4% |
| Ugandans | 76.1 /100 | #149 | Good 75.4% |
| Salvadorans | 74.8 /100 | #150 | Good 75.3% |
| Paiute | 74.1 /100 | #151 | Good 75.3% |
| Lebanese | 73.5 /100 | #152 | Good 75.3% |
| Guatemalans | 72.3 /100 | #153 | Good 75.3% |
| Osage | 72.3 /100 | #154 | Good 75.3% |
| Immigrants | Guatemala | 71.9 /100 | #155 | Good 75.3% |
| Immigrants | El Salvador | 71.7 /100 | #156 | Good 75.3% |
| Immigrants | Western Europe | 71.5 /100 | #157 | Good 75.3% |
| Immigrants | Bolivia | 71.0 /100 | #158 | Good 75.3% |
| South American Indians | 69.0 /100 | #159 | Good 75.3% |
| Japanese | 68.7 /100 | #160 | Good 75.3% |
| New Zealanders | 65.4 /100 | #161 | Good 75.2% |