Soviet Union vs Osage In Labor Force | Age 20-24
COMPARE
Soviet Union
Osage
In Labor Force | Age 20-24
In Labor Force | Age 20-24 Comparison
Soviet Union
Osage
72.3%
IN LABOR FORCE | AGE 20-24
0.0/ 100
METRIC RATING
308th/ 347
METRIC RANK
75.3%
IN LABOR FORCE | AGE 20-24
72.3/ 100
METRIC RATING
154th/ 347
METRIC RANK
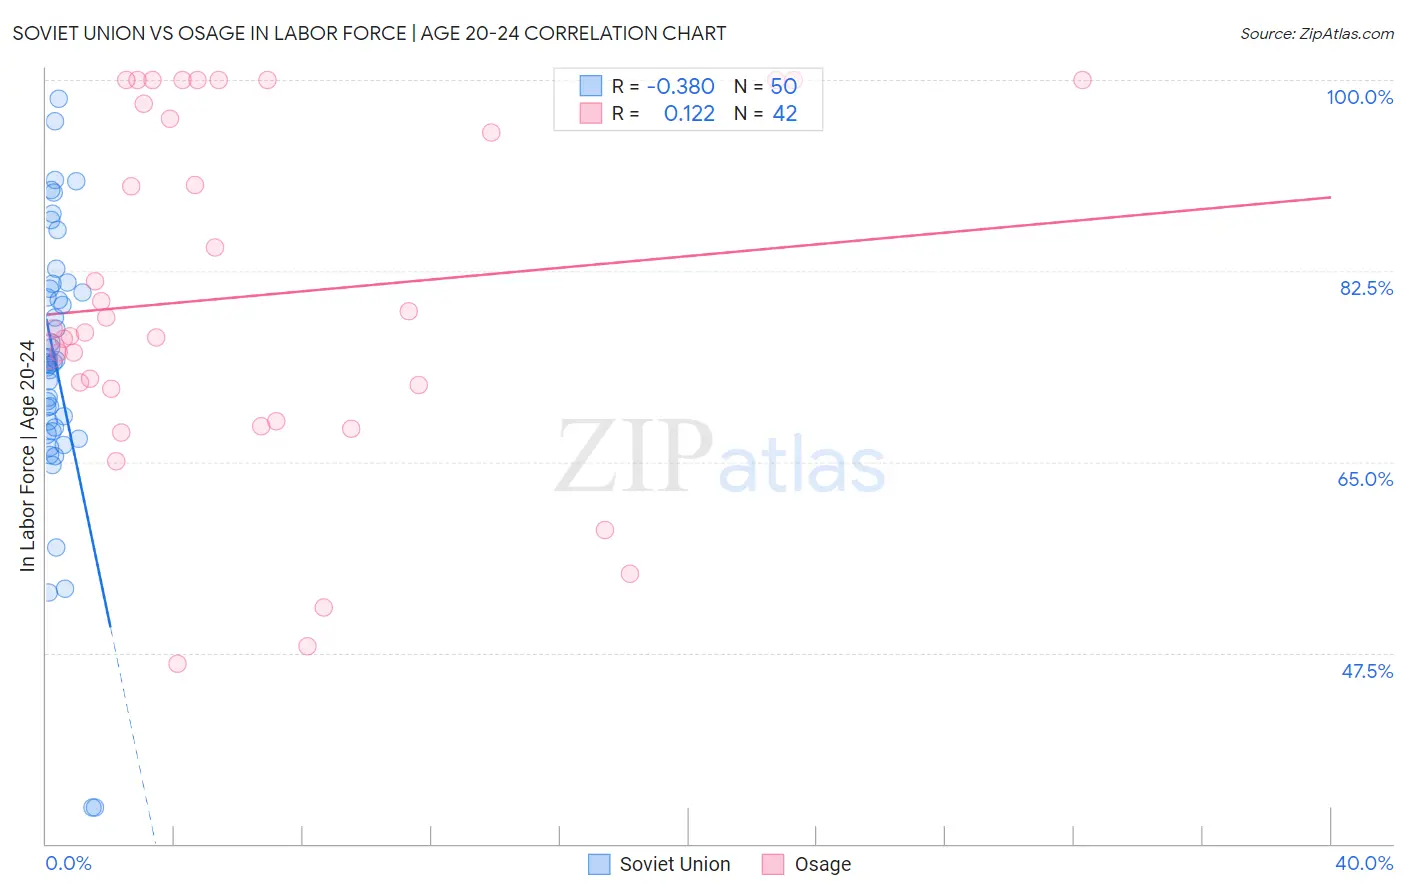
Soviet Union vs Osage In Labor Force | Age 20-24 Correlation Chart
The statistical analysis conducted on geographies consisting of 43,512,203 people shows a mild negative correlation between the proportion of Soviet Union and labor force participation rate among population between the ages 20 and 24 in the United States with a correlation coefficient (R) of -0.380 and weighted average of 72.3%. Similarly, the statistical analysis conducted on geographies consisting of 91,790,564 people shows a poor positive correlation between the proportion of Osage and labor force participation rate among population between the ages 20 and 24 in the United States with a correlation coefficient (R) of 0.122 and weighted average of 75.3%, a difference of 4.2%.
In Labor Force | Age 20-24 Correlation Summary
| Measurement | Soviet Union | Osage |
| Minimum | 33.3% | 46.5% |
| Maximum | 98.3% | 100.0% |
| Range | 65.0% | 53.5% |
| Mean | 73.7% | 80.2% |
| Median | 74.1% | 77.0% |
| Interquartile 25% (IQ1) | 67.8% | 71.7% |
| Interquartile 75% (IQ3) | 80.9% | 97.9% |
| Interquartile Range (IQR) | 13.0% | 26.2% |
| Standard Deviation (Sample) | 12.9% | 15.8% |
| Standard Deviation (Population) | 12.7% | 15.6% |
Similar Demographics by In Labor Force | Age 20-24
Demographics Similar to Soviet Union by In Labor Force | Age 20-24
In terms of in labor force | age 20-24, the demographic groups most similar to Soviet Union are Tsimshian (72.3%, a difference of 0.0%), Immigrants from Ecuador (72.3%, a difference of 0.010%), Immigrants from Jamaica (72.4%, a difference of 0.16%), Immigrants from Singapore (72.4%, a difference of 0.18%), and Immigrants from West Indies (72.4%, a difference of 0.21%).
| Demographics | Rating | Rank | In Labor Force | Age 20-24 |
| Cubans | 0.0 /100 | #301 | Tragic 72.5% |
| Natives/Alaskans | 0.0 /100 | #302 | Tragic 72.4% |
| Ecuadorians | 0.0 /100 | #303 | Tragic 72.4% |
| Immigrants | West Indies | 0.0 /100 | #304 | Tragic 72.4% |
| Immigrants | Singapore | 0.0 /100 | #305 | Tragic 72.4% |
| Immigrants | Jamaica | 0.0 /100 | #306 | Tragic 72.4% |
| Immigrants | Ecuador | 0.0 /100 | #307 | Tragic 72.3% |
| Soviet Union | 0.0 /100 | #308 | Tragic 72.3% |
| Tsimshian | 0.0 /100 | #309 | Tragic 72.3% |
| Immigrants | Cuba | 0.0 /100 | #310 | Tragic 72.0% |
| Apache | 0.0 /100 | #311 | Tragic 72.0% |
| Immigrants | Caribbean | 0.0 /100 | #312 | Tragic 71.9% |
| Immigrants | Dominica | 0.0 /100 | #313 | Tragic 71.9% |
| Indians (Asian) | 0.0 /100 | #314 | Tragic 71.9% |
| Immigrants | Iran | 0.0 /100 | #315 | Tragic 71.8% |
Demographics Similar to Osage by In Labor Force | Age 20-24
In terms of in labor force | age 20-24, the demographic groups most similar to Osage are Guatemalan (75.3%, a difference of 0.0%), Immigrants from Guatemala (75.3%, a difference of 0.010%), Immigrants from El Salvador (75.3%, a difference of 0.010%), Immigrants from Western Europe (75.3%, a difference of 0.010%), and Lebanese (75.3%, a difference of 0.020%).
| Demographics | Rating | Rank | In Labor Force | Age 20-24 |
| Comanche | 77.6 /100 | #147 | Good 75.4% |
| Immigrants | Cambodia | 76.7 /100 | #148 | Good 75.4% |
| Ugandans | 76.1 /100 | #149 | Good 75.4% |
| Salvadorans | 74.8 /100 | #150 | Good 75.3% |
| Paiute | 74.1 /100 | #151 | Good 75.3% |
| Lebanese | 73.5 /100 | #152 | Good 75.3% |
| Guatemalans | 72.3 /100 | #153 | Good 75.3% |
| Osage | 72.3 /100 | #154 | Good 75.3% |
| Immigrants | Guatemala | 71.9 /100 | #155 | Good 75.3% |
| Immigrants | El Salvador | 71.7 /100 | #156 | Good 75.3% |
| Immigrants | Western Europe | 71.5 /100 | #157 | Good 75.3% |
| Immigrants | Bolivia | 71.0 /100 | #158 | Good 75.3% |
| South American Indians | 69.0 /100 | #159 | Good 75.3% |
| Japanese | 68.7 /100 | #160 | Good 75.3% |
| New Zealanders | 65.4 /100 | #161 | Good 75.2% |