Greek vs Osage GED/Equivalency
COMPARE
Greek
Osage
GED/Equivalency
GED/Equivalency Comparison
Greeks
Osage
88.1%
GED/EQUIVALENCY
99.5/ 100
METRIC RATING
48th/ 347
METRIC RANK
84.8%
GED/EQUIVALENCY
9.5/ 100
METRIC RATING
214th/ 347
METRIC RANK
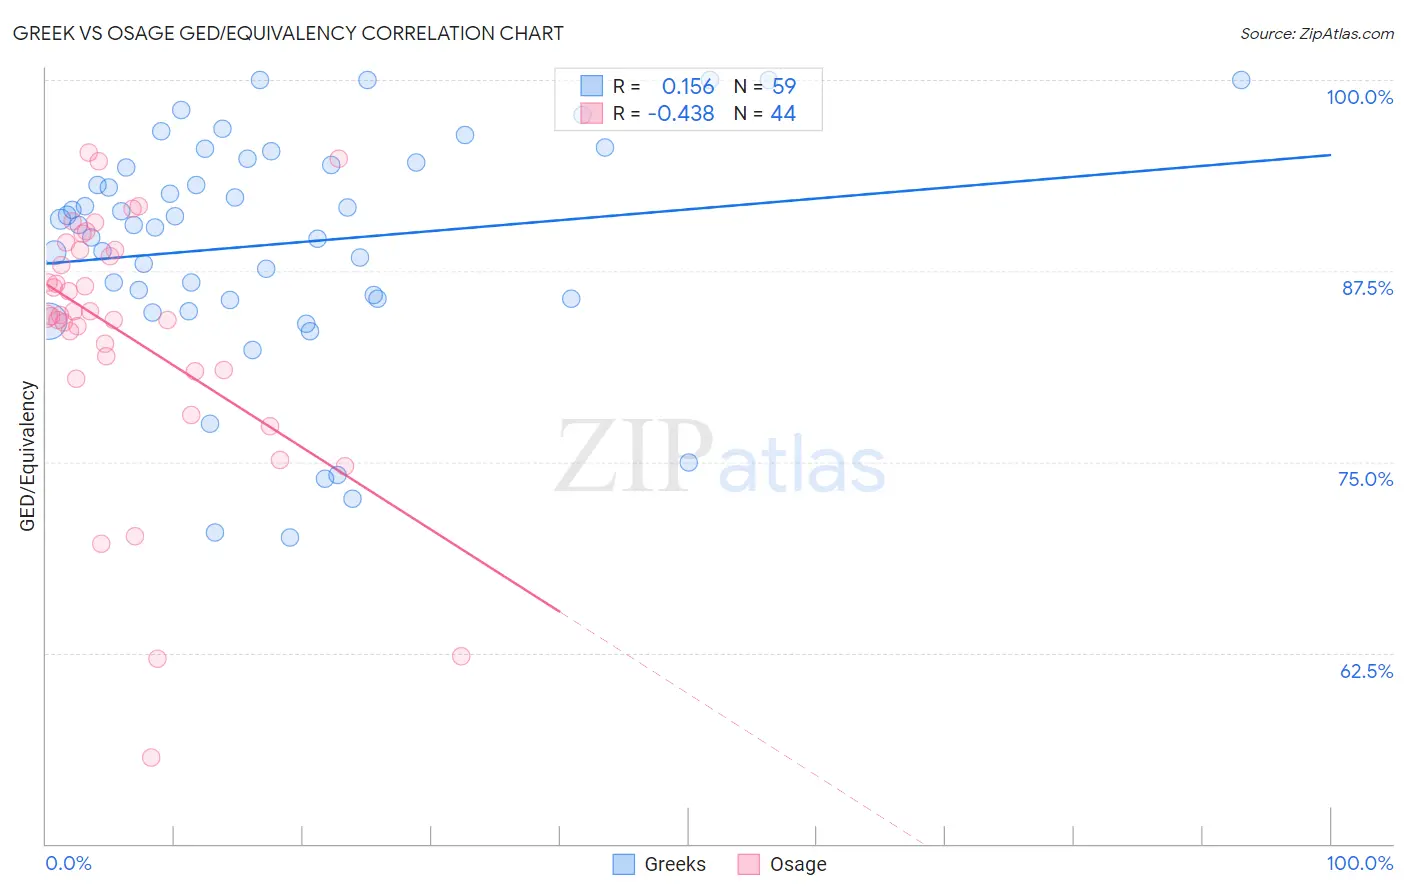
Greek vs Osage GED/Equivalency Correlation Chart
The statistical analysis conducted on geographies consisting of 482,775,362 people shows a poor positive correlation between the proportion of Greeks and percentage of population with at least ged/equivalency education in the United States with a correlation coefficient (R) of 0.156 and weighted average of 88.1%. Similarly, the statistical analysis conducted on geographies consisting of 91,808,913 people shows a moderate negative correlation between the proportion of Osage and percentage of population with at least ged/equivalency education in the United States with a correlation coefficient (R) of -0.438 and weighted average of 84.8%, a difference of 3.9%.
GED/Equivalency Correlation Summary
| Measurement | Greek | Osage |
| Minimum | 70.0% | 55.6% |
| Maximum | 100.0% | 95.3% |
| Range | 30.0% | 39.6% |
| Mean | 89.2% | 83.3% |
| Median | 90.5% | 84.6% |
| Interquartile 25% (IQ1) | 85.7% | 81.0% |
| Interquartile 75% (IQ3) | 94.6% | 88.9% |
| Interquartile Range (IQR) | 8.9% | 7.9% |
| Standard Deviation (Sample) | 7.5% | 8.6% |
| Standard Deviation (Population) | 7.4% | 8.5% |
Similar Demographics by GED/Equivalency
Demographics Similar to Greeks by GED/Equivalency
In terms of ged/equivalency, the demographic groups most similar to Greeks are Immigrants from Latvia (88.1%, a difference of 0.010%), Australian (88.1%, a difference of 0.010%), Immigrants from Switzerland (88.1%, a difference of 0.020%), Immigrants from Korea (88.1%, a difference of 0.020%), and Czech (88.1%, a difference of 0.030%).
| Demographics | Rating | Rank | GED/Equivalency |
| Finns | 99.6 /100 | #41 | Exceptional 88.2% |
| Cambodians | 99.6 /100 | #42 | Exceptional 88.2% |
| Immigrants | Scotland | 99.6 /100 | #43 | Exceptional 88.2% |
| Macedonians | 99.5 /100 | #44 | Exceptional 88.1% |
| Czechs | 99.5 /100 | #45 | Exceptional 88.1% |
| Immigrants | Switzerland | 99.5 /100 | #46 | Exceptional 88.1% |
| Immigrants | Latvia | 99.5 /100 | #47 | Exceptional 88.1% |
| Greeks | 99.5 /100 | #48 | Exceptional 88.1% |
| Australians | 99.5 /100 | #49 | Exceptional 88.1% |
| Immigrants | Korea | 99.5 /100 | #50 | Exceptional 88.1% |
| Immigrants | Netherlands | 99.4 /100 | #51 | Exceptional 88.0% |
| Zimbabweans | 99.4 /100 | #52 | Exceptional 88.0% |
| Immigrants | South Africa | 99.4 /100 | #53 | Exceptional 88.0% |
| Soviet Union | 99.4 /100 | #54 | Exceptional 88.0% |
| New Zealanders | 99.4 /100 | #55 | Exceptional 88.0% |
Demographics Similar to Osage by GED/Equivalency
In terms of ged/equivalency, the demographic groups most similar to Osage are Peruvian (84.7%, a difference of 0.020%), Immigrants from Philippines (84.8%, a difference of 0.030%), Immigrants from Micronesia (84.7%, a difference of 0.050%), Nigerian (84.7%, a difference of 0.050%), and Immigrants from Somalia (84.8%, a difference of 0.060%).
| Demographics | Rating | Rank | GED/Equivalency |
| Hmong | 13.1 /100 | #207 | Poor 84.9% |
| Marshallese | 12.5 /100 | #208 | Poor 84.9% |
| Colombians | 12.3 /100 | #209 | Poor 84.9% |
| Immigrants | Cameroon | 12.1 /100 | #210 | Poor 84.9% |
| South Americans | 10.9 /100 | #211 | Poor 84.8% |
| Immigrants | Somalia | 10.6 /100 | #212 | Poor 84.8% |
| Immigrants | Philippines | 10.0 /100 | #213 | Poor 84.8% |
| Osage | 9.5 /100 | #214 | Tragic 84.8% |
| Peruvians | 9.2 /100 | #215 | Tragic 84.7% |
| Immigrants | Micronesia | 8.7 /100 | #216 | Tragic 84.7% |
| Nigerians | 8.6 /100 | #217 | Tragic 84.7% |
| Alaska Natives | 8.6 /100 | #218 | Tragic 84.7% |
| Potawatomi | 8.2 /100 | #219 | Tragic 84.7% |
| Americans | 8.2 /100 | #220 | Tragic 84.7% |
| Taiwanese | 8.1 /100 | #221 | Tragic 84.7% |