Puget Sound Salish vs Osage In Labor Force | Age 20-24
COMPARE
Puget Sound Salish
Osage
In Labor Force | Age 20-24
In Labor Force | Age 20-24 Comparison
Puget Sound Salish
Osage
78.0%
IN LABOR FORCE | AGE 20-24
100.0/ 100
METRIC RATING
21st/ 347
METRIC RANK
75.3%
IN LABOR FORCE | AGE 20-24
72.3/ 100
METRIC RATING
154th/ 347
METRIC RANK
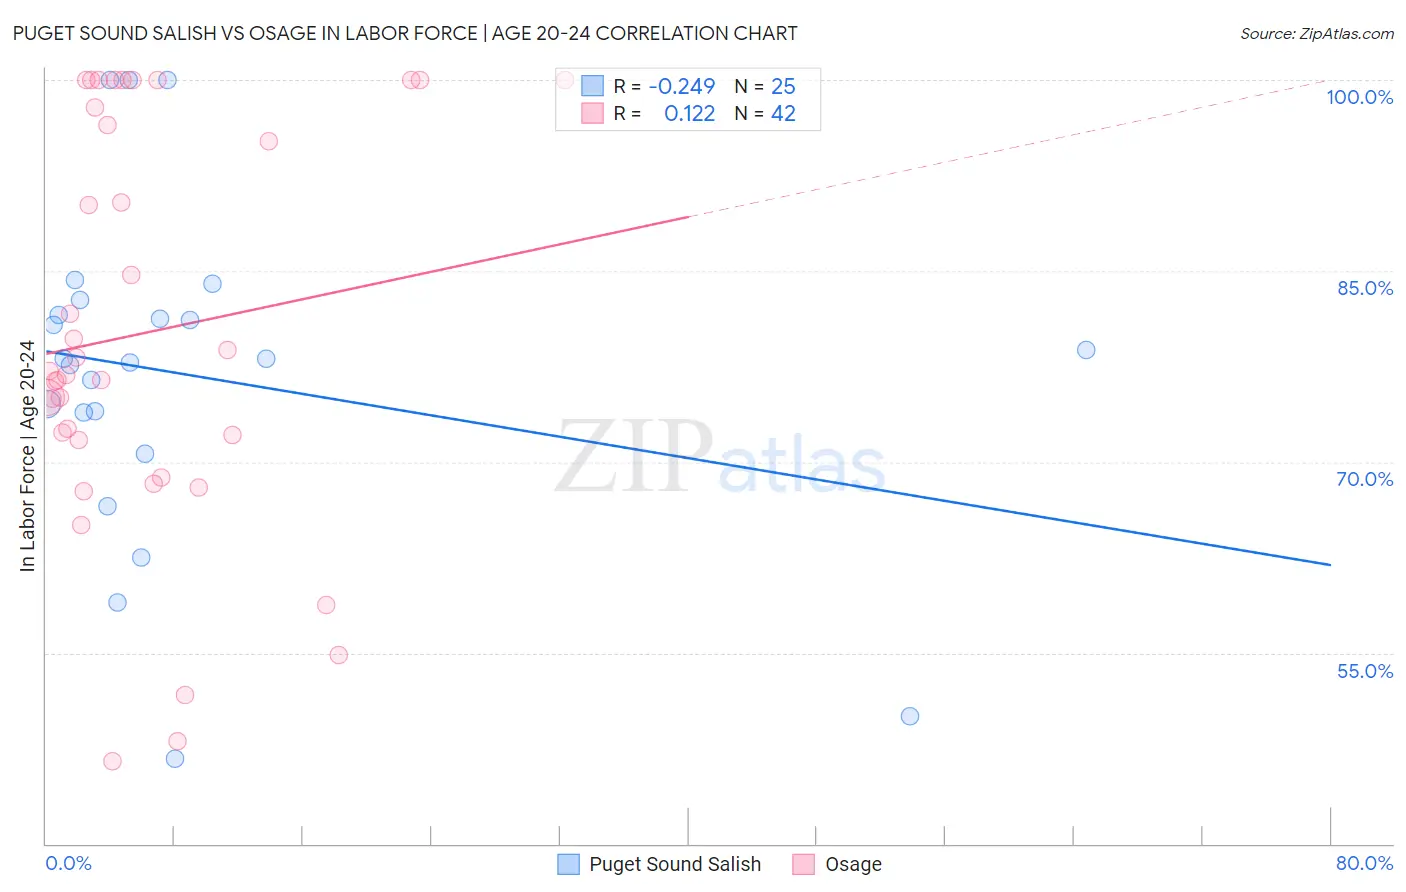
Puget Sound Salish vs Osage In Labor Force | Age 20-24 Correlation Chart
The statistical analysis conducted on geographies consisting of 46,155,398 people shows a weak negative correlation between the proportion of Puget Sound Salish and labor force participation rate among population between the ages 20 and 24 in the United States with a correlation coefficient (R) of -0.249 and weighted average of 78.0%. Similarly, the statistical analysis conducted on geographies consisting of 91,790,564 people shows a poor positive correlation between the proportion of Osage and labor force participation rate among population between the ages 20 and 24 in the United States with a correlation coefficient (R) of 0.122 and weighted average of 75.3%, a difference of 3.6%.
In Labor Force | Age 20-24 Correlation Summary
| Measurement | Puget Sound Salish | Osage |
| Minimum | 46.7% | 46.5% |
| Maximum | 100.0% | 100.0% |
| Range | 53.3% | 53.5% |
| Mean | 76.8% | 80.2% |
| Median | 78.1% | 77.0% |
| Interquartile 25% (IQ1) | 72.2% | 71.7% |
| Interquartile 75% (IQ3) | 82.1% | 97.9% |
| Interquartile Range (IQR) | 9.9% | 26.2% |
| Standard Deviation (Sample) | 13.2% | 15.8% |
| Standard Deviation (Population) | 12.9% | 15.6% |
Similar Demographics by In Labor Force | Age 20-24
Demographics Similar to Puget Sound Salish by In Labor Force | Age 20-24
In terms of in labor force | age 20-24, the demographic groups most similar to Puget Sound Salish are Pennsylvania German (78.0%, a difference of 0.060%), French Canadian (78.1%, a difference of 0.070%), Yugoslavian (78.0%, a difference of 0.070%), Liberian (78.0%, a difference of 0.070%), and Tlingit-Haida (77.9%, a difference of 0.11%).
| Demographics | Rating | Rank | In Labor Force | Age 20-24 |
| Czechs | 100.0 /100 | #14 | Exceptional 78.5% |
| Sudanese | 100.0 /100 | #15 | Exceptional 78.4% |
| Dutch | 100.0 /100 | #16 | Exceptional 78.4% |
| Cape Verdeans | 100.0 /100 | #17 | Exceptional 78.3% |
| Immigrants | Bosnia and Herzegovina | 100.0 /100 | #18 | Exceptional 78.1% |
| Bangladeshis | 100.0 /100 | #19 | Exceptional 78.1% |
| French Canadians | 100.0 /100 | #20 | Exceptional 78.1% |
| Puget Sound Salish | 100.0 /100 | #21 | Exceptional 78.0% |
| Pennsylvania Germans | 100.0 /100 | #22 | Exceptional 78.0% |
| Yugoslavians | 100.0 /100 | #23 | Exceptional 78.0% |
| Liberians | 100.0 /100 | #24 | Exceptional 78.0% |
| Tlingit-Haida | 100.0 /100 | #25 | Exceptional 77.9% |
| Tongans | 100.0 /100 | #26 | Exceptional 77.9% |
| Immigrants | Micronesia | 100.0 /100 | #27 | Exceptional 77.8% |
| Belgians | 100.0 /100 | #28 | Exceptional 77.8% |
Demographics Similar to Osage by In Labor Force | Age 20-24
In terms of in labor force | age 20-24, the demographic groups most similar to Osage are Guatemalan (75.3%, a difference of 0.0%), Immigrants from Guatemala (75.3%, a difference of 0.010%), Immigrants from El Salvador (75.3%, a difference of 0.010%), Immigrants from Western Europe (75.3%, a difference of 0.010%), and Lebanese (75.3%, a difference of 0.020%).
| Demographics | Rating | Rank | In Labor Force | Age 20-24 |
| Comanche | 77.6 /100 | #147 | Good 75.4% |
| Immigrants | Cambodia | 76.7 /100 | #148 | Good 75.4% |
| Ugandans | 76.1 /100 | #149 | Good 75.4% |
| Salvadorans | 74.8 /100 | #150 | Good 75.3% |
| Paiute | 74.1 /100 | #151 | Good 75.3% |
| Lebanese | 73.5 /100 | #152 | Good 75.3% |
| Guatemalans | 72.3 /100 | #153 | Good 75.3% |
| Osage | 72.3 /100 | #154 | Good 75.3% |
| Immigrants | Guatemala | 71.9 /100 | #155 | Good 75.3% |
| Immigrants | El Salvador | 71.7 /100 | #156 | Good 75.3% |
| Immigrants | Western Europe | 71.5 /100 | #157 | Good 75.3% |
| Immigrants | Bolivia | 71.0 /100 | #158 | Good 75.3% |
| South American Indians | 69.0 /100 | #159 | Good 75.3% |
| Japanese | 68.7 /100 | #160 | Good 75.3% |
| New Zealanders | 65.4 /100 | #161 | Good 75.2% |