Cheyenne vs Osage In Labor Force | Age 20-24
COMPARE
Cheyenne
Osage
In Labor Force | Age 20-24
In Labor Force | Age 20-24 Comparison
Cheyenne
Osage
73.4%
IN LABOR FORCE | AGE 20-24
0.2/ 100
METRIC RATING
273rd/ 347
METRIC RANK
75.3%
IN LABOR FORCE | AGE 20-24
72.3/ 100
METRIC RATING
154th/ 347
METRIC RANK
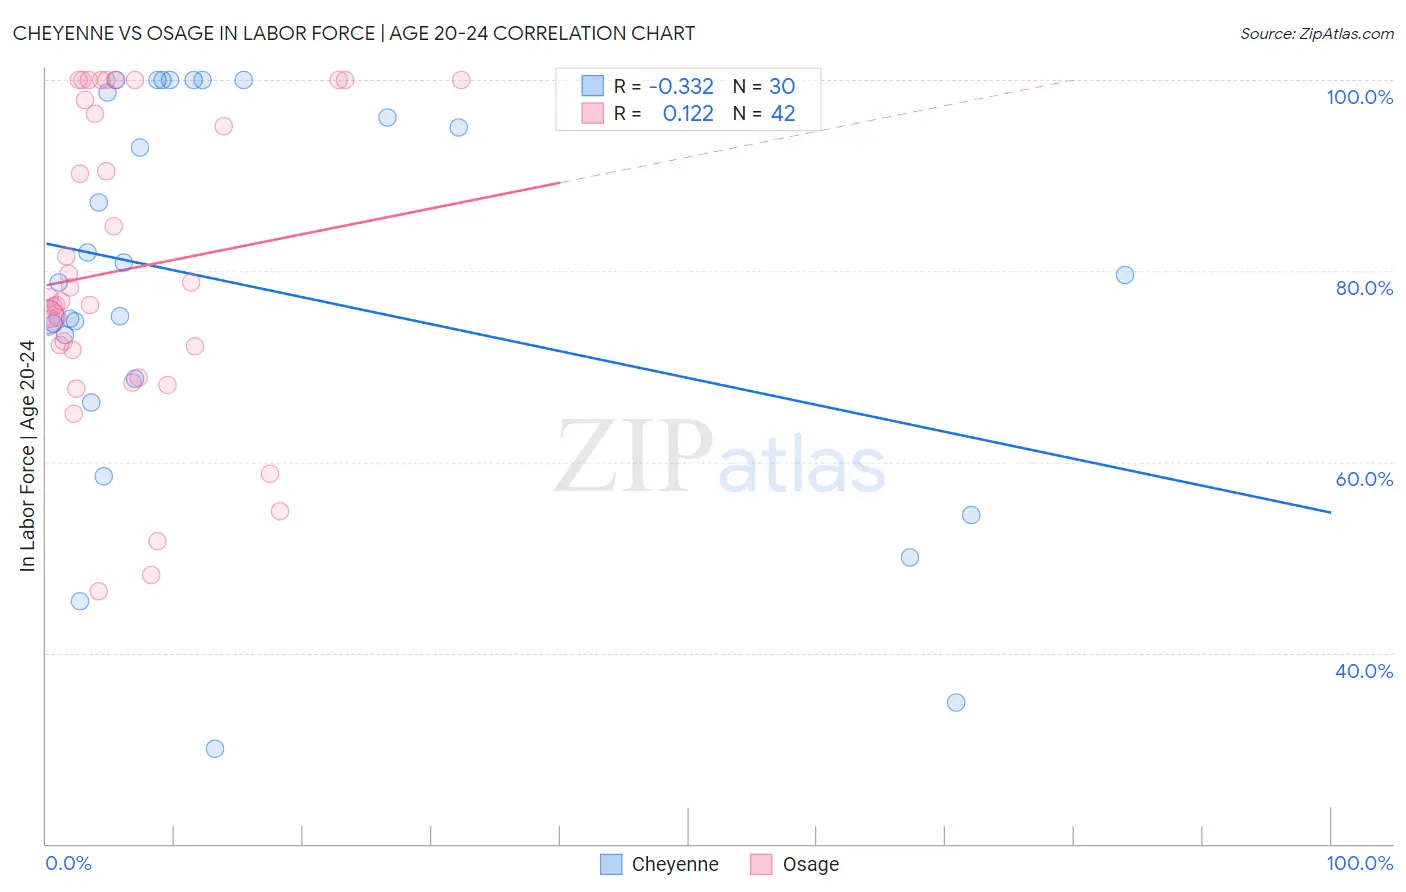
Cheyenne vs Osage In Labor Force | Age 20-24 Correlation Chart
The statistical analysis conducted on geographies consisting of 80,658,593 people shows a mild negative correlation between the proportion of Cheyenne and labor force participation rate among population between the ages 20 and 24 in the United States with a correlation coefficient (R) of -0.332 and weighted average of 73.4%. Similarly, the statistical analysis conducted on geographies consisting of 91,790,564 people shows a poor positive correlation between the proportion of Osage and labor force participation rate among population between the ages 20 and 24 in the United States with a correlation coefficient (R) of 0.122 and weighted average of 75.3%, a difference of 2.6%.
In Labor Force | Age 20-24 Correlation Summary
| Measurement | Cheyenne | Osage |
| Minimum | 30.0% | 46.5% |
| Maximum | 100.0% | 100.0% |
| Range | 70.0% | 53.5% |
| Mean | 78.2% | 80.2% |
| Median | 79.2% | 77.0% |
| Interquartile 25% (IQ1) | 68.6% | 71.7% |
| Interquartile 75% (IQ3) | 98.7% | 97.9% |
| Interquartile Range (IQR) | 30.1% | 26.2% |
| Standard Deviation (Sample) | 20.4% | 15.8% |
| Standard Deviation (Population) | 20.0% | 15.6% |
Similar Demographics by In Labor Force | Age 20-24
Demographics Similar to Cheyenne by In Labor Force | Age 20-24
In terms of in labor force | age 20-24, the demographic groups most similar to Cheyenne are Immigrants from Colombia (73.4%, a difference of 0.020%), Belizean (73.4%, a difference of 0.030%), Immigrants from Indonesia (73.4%, a difference of 0.040%), Immigrants from South America (73.3%, a difference of 0.070%), and Mongolian (73.3%, a difference of 0.080%).
| Demographics | Rating | Rank | In Labor Force | Age 20-24 |
| Haitians | 0.5 /100 | #266 | Tragic 73.6% |
| Immigrants | Western Asia | 0.4 /100 | #267 | Tragic 73.5% |
| South Americans | 0.4 /100 | #268 | Tragic 73.5% |
| Colombians | 0.3 /100 | #269 | Tragic 73.5% |
| Immigrants | Russia | 0.3 /100 | #270 | Tragic 73.5% |
| Immigrants | Indonesia | 0.3 /100 | #271 | Tragic 73.4% |
| Belizeans | 0.3 /100 | #272 | Tragic 73.4% |
| Cheyenne | 0.2 /100 | #273 | Tragic 73.4% |
| Immigrants | Colombia | 0.2 /100 | #274 | Tragic 73.4% |
| Immigrants | South America | 0.2 /100 | #275 | Tragic 73.3% |
| Mongolians | 0.2 /100 | #276 | Tragic 73.3% |
| Immigrants | Malaysia | 0.2 /100 | #277 | Tragic 73.3% |
| Cypriots | 0.2 /100 | #278 | Tragic 73.3% |
| Venezuelans | 0.2 /100 | #279 | Tragic 73.3% |
| Bahamians | 0.1 /100 | #280 | Tragic 73.3% |
Demographics Similar to Osage by In Labor Force | Age 20-24
In terms of in labor force | age 20-24, the demographic groups most similar to Osage are Guatemalan (75.3%, a difference of 0.0%), Immigrants from Guatemala (75.3%, a difference of 0.010%), Immigrants from El Salvador (75.3%, a difference of 0.010%), Immigrants from Western Europe (75.3%, a difference of 0.010%), and Lebanese (75.3%, a difference of 0.020%).
| Demographics | Rating | Rank | In Labor Force | Age 20-24 |
| Comanche | 77.6 /100 | #147 | Good 75.4% |
| Immigrants | Cambodia | 76.7 /100 | #148 | Good 75.4% |
| Ugandans | 76.1 /100 | #149 | Good 75.4% |
| Salvadorans | 74.8 /100 | #150 | Good 75.3% |
| Paiute | 74.1 /100 | #151 | Good 75.3% |
| Lebanese | 73.5 /100 | #152 | Good 75.3% |
| Guatemalans | 72.3 /100 | #153 | Good 75.3% |
| Osage | 72.3 /100 | #154 | Good 75.3% |
| Immigrants | Guatemala | 71.9 /100 | #155 | Good 75.3% |
| Immigrants | El Salvador | 71.7 /100 | #156 | Good 75.3% |
| Immigrants | Western Europe | 71.5 /100 | #157 | Good 75.3% |
| Immigrants | Bolivia | 71.0 /100 | #158 | Good 75.3% |
| South American Indians | 69.0 /100 | #159 | Good 75.3% |
| Japanese | 68.7 /100 | #160 | Good 75.3% |
| New Zealanders | 65.4 /100 | #161 | Good 75.2% |