Chilean vs Immigrants from South Eastern Asia In Labor Force | Age > 16
COMPARE
Chilean
Immigrants from South Eastern Asia
In Labor Force | Age > 16
In Labor Force | Age > 16 Comparison
Chileans
Immigrants from South Eastern Asia
66.0%
IN LABOR FORCE | AGE > 16
99.2/ 100
METRIC RATING
90th/ 347
METRIC RANK
65.9%
IN LABOR FORCE | AGE > 16
98.5/ 100
METRIC RATING
103rd/ 347
METRIC RANK
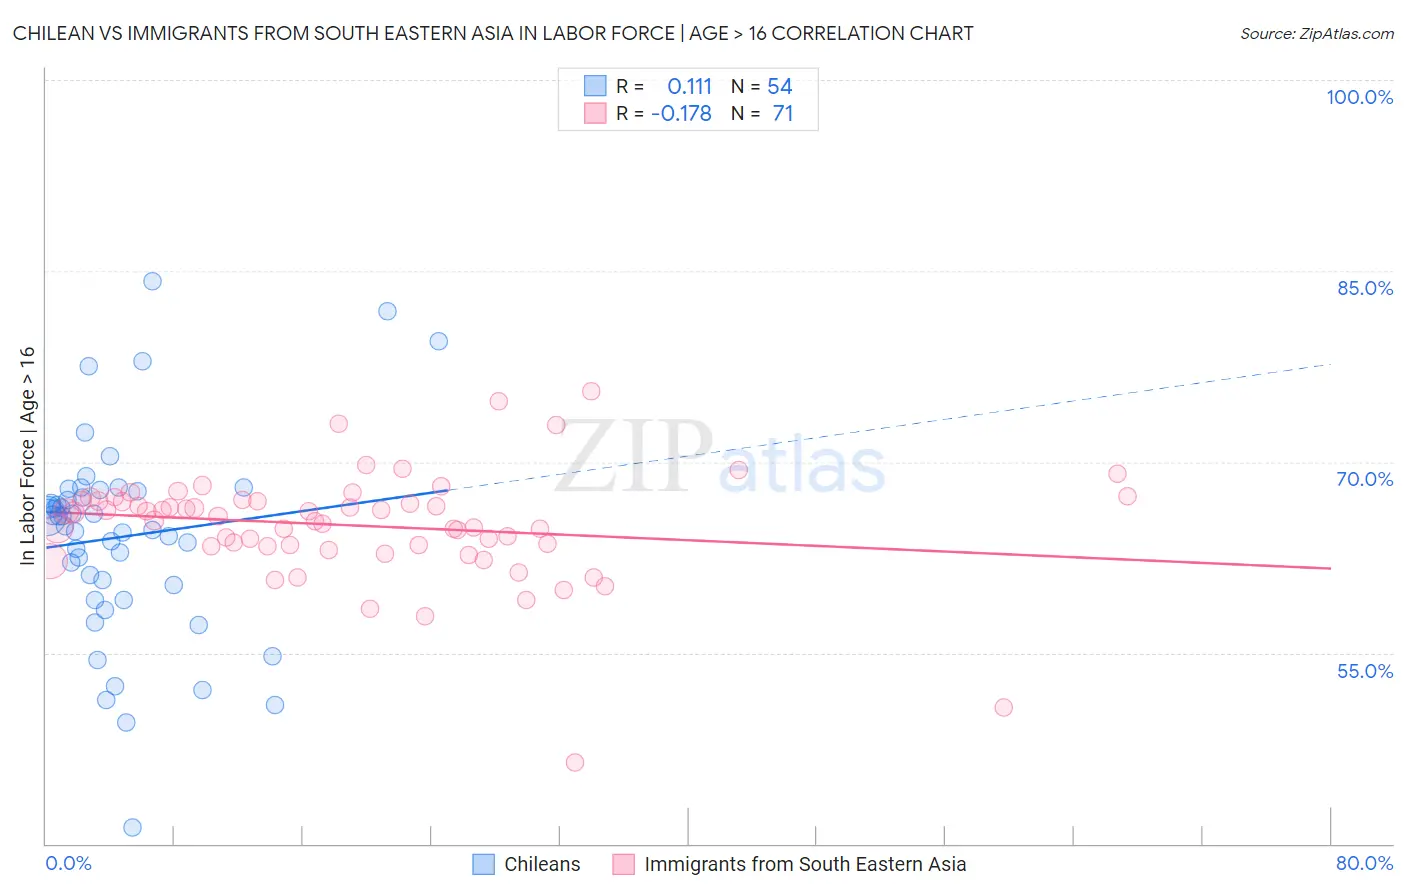
Chilean vs Immigrants from South Eastern Asia In Labor Force | Age > 16 Correlation Chart
The statistical analysis conducted on geographies consisting of 256,687,102 people shows a poor positive correlation between the proportion of Chileans and labor force participation rate among population ages 16 and over in the United States with a correlation coefficient (R) of 0.111 and weighted average of 66.0%. Similarly, the statistical analysis conducted on geographies consisting of 512,696,478 people shows a poor negative correlation between the proportion of Immigrants from South Eastern Asia and labor force participation rate among population ages 16 and over in the United States with a correlation coefficient (R) of -0.178 and weighted average of 65.9%, a difference of 0.18%.
In Labor Force | Age > 16 Correlation Summary
| Measurement | Chilean | Immigrants from South Eastern Asia |
| Minimum | 41.3% | 46.4% |
| Maximum | 84.2% | 75.5% |
| Range | 42.9% | 29.1% |
| Mean | 64.1% | 65.0% |
| Median | 65.3% | 65.7% |
| Interquartile 25% (IQ1) | 60.3% | 63.3% |
| Interquartile 75% (IQ3) | 67.7% | 66.9% |
| Interquartile Range (IQR) | 7.4% | 3.6% |
| Standard Deviation (Sample) | 8.0% | 4.4% |
| Standard Deviation (Population) | 7.9% | 4.4% |
Demographics Similar to Chileans and Immigrants from South Eastern Asia by In Labor Force | Age > 16
In terms of in labor force | age > 16, the demographic groups most similar to Chileans are Immigrants from Laos (66.0%, a difference of 0.0%), Iranian (66.0%, a difference of 0.010%), Aleut (66.0%, a difference of 0.030%), Immigrants from South America (66.0%, a difference of 0.030%), and South American Indian (66.0%, a difference of 0.050%). Similarly, the demographic groups most similar to Immigrants from South Eastern Asia are Palestinian (65.9%, a difference of 0.010%), Immigrants from Colombia (65.9%, a difference of 0.020%), Uruguayan (65.9%, a difference of 0.020%), Colombian (65.9%, a difference of 0.020%), and Immigrants from Australia (65.9%, a difference of 0.030%).
| Demographics | Rating | Rank | In Labor Force | Age > 16 |
| South Americans | 99.4 /100 | #86 | Exceptional 66.0% |
| South American Indians | 99.4 /100 | #87 | Exceptional 66.0% |
| Bermudans | 99.3 /100 | #88 | Exceptional 66.0% |
| Immigrants | Laos | 99.2 /100 | #89 | Exceptional 66.0% |
| Chileans | 99.2 /100 | #90 | Exceptional 66.0% |
| Iranians | 99.2 /100 | #91 | Exceptional 66.0% |
| Aleuts | 99.1 /100 | #92 | Exceptional 66.0% |
| Immigrants | South America | 99.1 /100 | #93 | Exceptional 66.0% |
| Immigrants | Cambodia | 99.1 /100 | #94 | Exceptional 66.0% |
| Immigrants | Uruguay | 99.1 /100 | #95 | Exceptional 66.0% |
| Bangladeshis | 98.9 /100 | #96 | Exceptional 65.9% |
| Filipinos | 98.9 /100 | #97 | Exceptional 65.9% |
| Immigrants | Chile | 98.7 /100 | #98 | Exceptional 65.9% |
| Immigrants | Australia | 98.7 /100 | #99 | Exceptional 65.9% |
| Okinawans | 98.7 /100 | #100 | Exceptional 65.9% |
| Immigrants | Colombia | 98.6 /100 | #101 | Exceptional 65.9% |
| Uruguayans | 98.6 /100 | #102 | Exceptional 65.9% |
| Immigrants | South Eastern Asia | 98.5 /100 | #103 | Exceptional 65.9% |
| Palestinians | 98.5 /100 | #104 | Exceptional 65.9% |
| Colombians | 98.4 /100 | #105 | Exceptional 65.9% |
| Immigrants | Serbia | 98.1 /100 | #106 | Exceptional 65.8% |