Chilean vs Immigrants from Dominica In Labor Force | Age > 16
COMPARE
Chilean
Immigrants from Dominica
In Labor Force | Age > 16
In Labor Force | Age > 16 Comparison
Chileans
Immigrants from Dominica
66.0%
IN LABOR FORCE | AGE > 16
99.2/ 100
METRIC RATING
90th/ 347
METRIC RANK
64.5%
IN LABOR FORCE | AGE > 16
3.5/ 100
METRIC RATING
241st/ 347
METRIC RANK
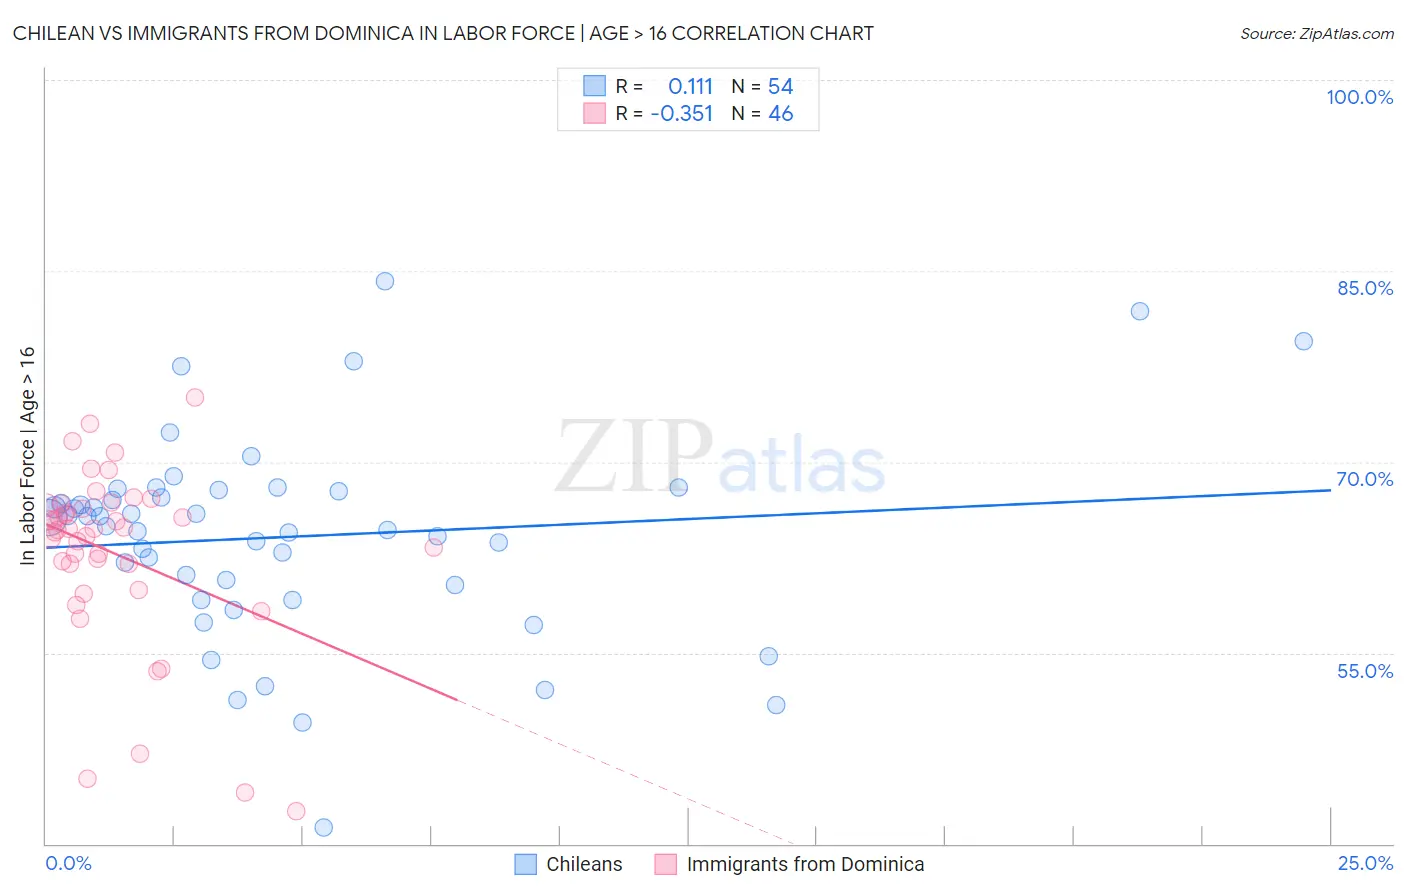
Chilean vs Immigrants from Dominica In Labor Force | Age > 16 Correlation Chart
The statistical analysis conducted on geographies consisting of 256,687,102 people shows a poor positive correlation between the proportion of Chileans and labor force participation rate among population ages 16 and over in the United States with a correlation coefficient (R) of 0.111 and weighted average of 66.0%. Similarly, the statistical analysis conducted on geographies consisting of 83,796,433 people shows a mild negative correlation between the proportion of Immigrants from Dominica and labor force participation rate among population ages 16 and over in the United States with a correlation coefficient (R) of -0.351 and weighted average of 64.5%, a difference of 2.3%.
In Labor Force | Age > 16 Correlation Summary
| Measurement | Chilean | Immigrants from Dominica |
| Minimum | 41.3% | 42.6% |
| Maximum | 84.2% | 75.1% |
| Range | 42.9% | 32.5% |
| Mean | 64.1% | 62.8% |
| Median | 65.3% | 64.7% |
| Interquartile 25% (IQ1) | 60.3% | 62.0% |
| Interquartile 75% (IQ3) | 67.7% | 66.6% |
| Interquartile Range (IQR) | 7.4% | 4.6% |
| Standard Deviation (Sample) | 8.0% | 7.1% |
| Standard Deviation (Population) | 7.9% | 7.0% |
Similar Demographics by In Labor Force | Age > 16
Demographics Similar to Chileans by In Labor Force | Age > 16
In terms of in labor force | age > 16, the demographic groups most similar to Chileans are Immigrants from Laos (66.0%, a difference of 0.0%), Iranian (66.0%, a difference of 0.010%), Aleut (66.0%, a difference of 0.030%), Immigrants from South America (66.0%, a difference of 0.030%), and South American Indian (66.0%, a difference of 0.050%).
| Demographics | Rating | Rank | In Labor Force | Age > 16 |
| Immigrants | Jordan | 99.4 /100 | #83 | Exceptional 66.1% |
| Central Americans | 99.4 /100 | #84 | Exceptional 66.1% |
| Mongolians | 99.4 /100 | #85 | Exceptional 66.1% |
| South Americans | 99.4 /100 | #86 | Exceptional 66.0% |
| South American Indians | 99.4 /100 | #87 | Exceptional 66.0% |
| Bermudans | 99.3 /100 | #88 | Exceptional 66.0% |
| Immigrants | Laos | 99.2 /100 | #89 | Exceptional 66.0% |
| Chileans | 99.2 /100 | #90 | Exceptional 66.0% |
| Iranians | 99.2 /100 | #91 | Exceptional 66.0% |
| Aleuts | 99.1 /100 | #92 | Exceptional 66.0% |
| Immigrants | South America | 99.1 /100 | #93 | Exceptional 66.0% |
| Immigrants | Cambodia | 99.1 /100 | #94 | Exceptional 66.0% |
| Immigrants | Uruguay | 99.1 /100 | #95 | Exceptional 66.0% |
| Bangladeshis | 98.9 /100 | #96 | Exceptional 65.9% |
| Filipinos | 98.9 /100 | #97 | Exceptional 65.9% |
Demographics Similar to Immigrants from Dominica by In Labor Force | Age > 16
In terms of in labor force | age > 16, the demographic groups most similar to Immigrants from Dominica are Immigrants from Bangladesh (64.5%, a difference of 0.0%), Immigrants from Netherlands (64.5%, a difference of 0.010%), Immigrants from Hungary (64.5%, a difference of 0.020%), Lebanese (64.5%, a difference of 0.030%), and Immigrants from Lebanon (64.5%, a difference of 0.030%).
| Demographics | Rating | Rank | In Labor Force | Age > 16 |
| Vietnamese | 4.7 /100 | #234 | Tragic 64.6% |
| Austrians | 4.6 /100 | #235 | Tragic 64.6% |
| Immigrants | Norway | 4.6 /100 | #236 | Tragic 64.6% |
| Italians | 4.6 /100 | #237 | Tragic 64.6% |
| Lebanese | 3.9 /100 | #238 | Tragic 64.5% |
| Immigrants | Hungary | 3.8 /100 | #239 | Tragic 64.5% |
| Immigrants | Bangladesh | 3.6 /100 | #240 | Tragic 64.5% |
| Immigrants | Dominica | 3.5 /100 | #241 | Tragic 64.5% |
| Immigrants | Netherlands | 3.4 /100 | #242 | Tragic 64.5% |
| Immigrants | Lebanon | 3.2 /100 | #243 | Tragic 64.5% |
| Tsimshian | 3.1 /100 | #244 | Tragic 64.5% |
| West Indians | 3.0 /100 | #245 | Tragic 64.5% |
| Immigrants | Caribbean | 2.3 /100 | #246 | Tragic 64.4% |
| Swiss | 2.1 /100 | #247 | Tragic 64.4% |
| Immigrants | Barbados | 2.1 /100 | #248 | Tragic 64.4% |