Latvian vs Immigrants from Trinidad and Tobago In Labor Force | Age > 16
COMPARE
Latvian
Immigrants from Trinidad and Tobago
In Labor Force | Age > 16
In Labor Force | Age > 16 Comparison
Latvians
Immigrants from Trinidad and Tobago
65.5%
IN LABOR FORCE | AGE > 16
89.4/ 100
METRIC RATING
143rd/ 347
METRIC RANK
64.8%
IN LABOR FORCE | AGE > 16
15.6/ 100
METRIC RATING
209th/ 347
METRIC RANK
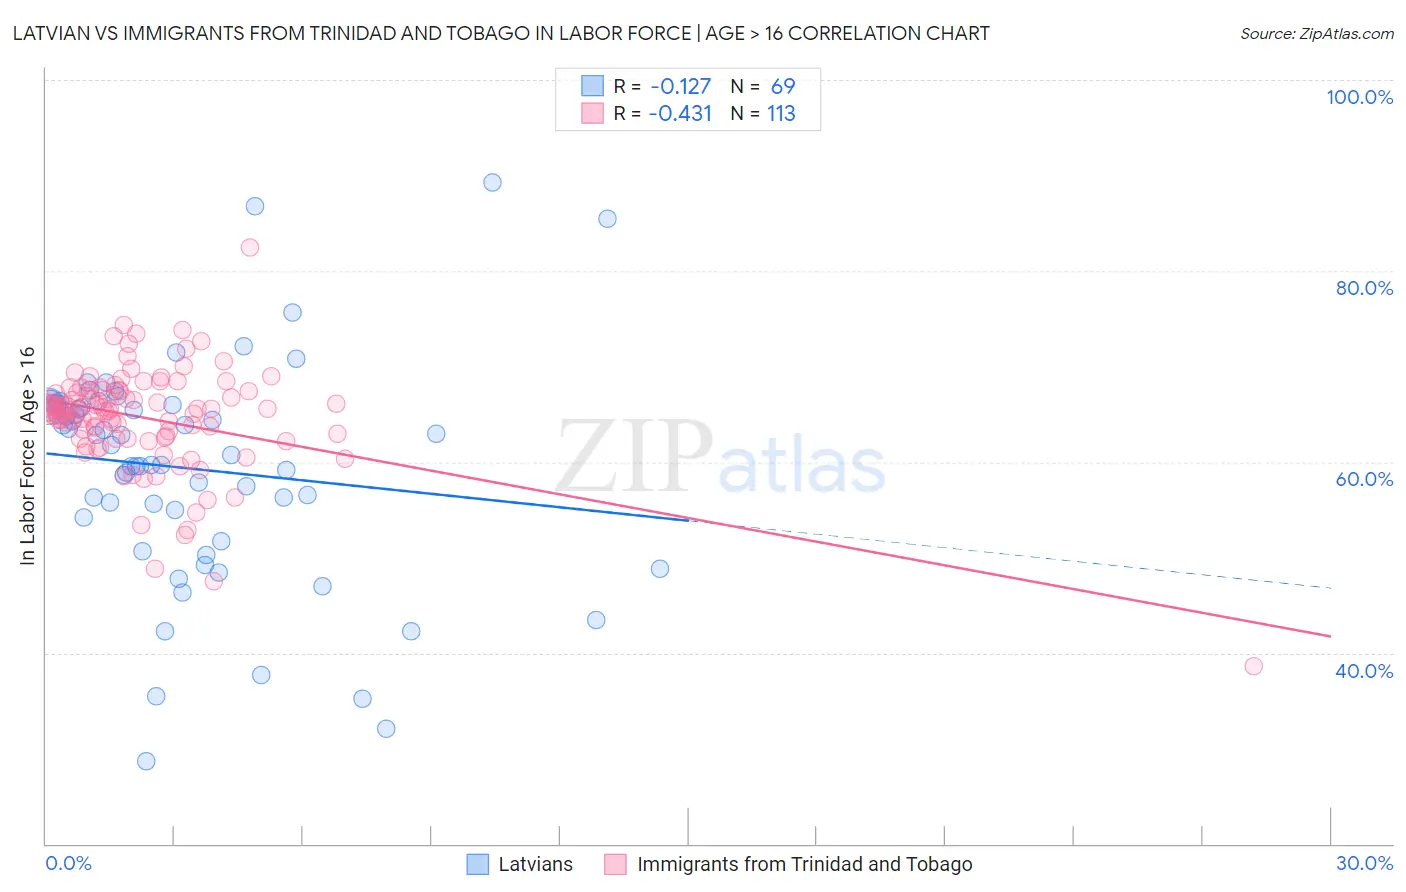
Latvian vs Immigrants from Trinidad and Tobago In Labor Force | Age > 16 Correlation Chart
The statistical analysis conducted on geographies consisting of 220,727,304 people shows a poor negative correlation between the proportion of Latvians and labor force participation rate among population ages 16 and over in the United States with a correlation coefficient (R) of -0.127 and weighted average of 65.5%. Similarly, the statistical analysis conducted on geographies consisting of 223,535,582 people shows a moderate negative correlation between the proportion of Immigrants from Trinidad and Tobago and labor force participation rate among population ages 16 and over in the United States with a correlation coefficient (R) of -0.431 and weighted average of 64.8%, a difference of 1.1%.
In Labor Force | Age > 16 Correlation Summary
| Measurement | Latvian | Immigrants from Trinidad and Tobago |
| Minimum | 28.6% | 38.6% |
| Maximum | 89.2% | 82.4% |
| Range | 60.6% | 43.8% |
| Mean | 59.3% | 64.6% |
| Median | 60.8% | 65.5% |
| Interquartile 25% (IQ1) | 52.9% | 62.5% |
| Interquartile 75% (IQ3) | 66.1% | 67.4% |
| Interquartile Range (IQR) | 13.2% | 4.9% |
| Standard Deviation (Sample) | 11.7% | 5.6% |
| Standard Deviation (Population) | 11.6% | 5.6% |
Similar Demographics by In Labor Force | Age > 16
Demographics Similar to Latvians by In Labor Force | Age > 16
In terms of in labor force | age > 16, the demographic groups most similar to Latvians are Indian (Asian) (65.5%, a difference of 0.0%), Immigrants from Romania (65.5%, a difference of 0.020%), Samoan (65.5%, a difference of 0.030%), Tlingit-Haida (65.5%, a difference of 0.030%), and Immigrants from Taiwan (65.5%, a difference of 0.040%).
| Demographics | Rating | Rank | In Labor Force | Age > 16 |
| Immigrants | Argentina | 92.4 /100 | #136 | Exceptional 65.6% |
| Guamanians/Chamorros | 92.4 /100 | #137 | Exceptional 65.6% |
| Immigrants | West Indies | 92.0 /100 | #138 | Exceptional 65.6% |
| Immigrants | Taiwan | 90.8 /100 | #139 | Exceptional 65.5% |
| Immigrants | Costa Rica | 90.8 /100 | #140 | Exceptional 65.5% |
| Samoans | 90.5 /100 | #141 | Exceptional 65.5% |
| Indians (Asian) | 89.5 /100 | #142 | Excellent 65.5% |
| Latvians | 89.4 /100 | #143 | Excellent 65.5% |
| Immigrants | Romania | 88.6 /100 | #144 | Excellent 65.5% |
| Tlingit-Haida | 88.3 /100 | #145 | Excellent 65.5% |
| Cypriots | 88.2 /100 | #146 | Excellent 65.5% |
| Immigrants | Oceania | 87.5 /100 | #147 | Excellent 65.5% |
| Bhutanese | 86.3 /100 | #148 | Excellent 65.5% |
| Immigrants | Albania | 85.7 /100 | #149 | Excellent 65.4% |
| Immigrants | Immigrants | 81.9 /100 | #150 | Excellent 65.4% |
Demographics Similar to Immigrants from Trinidad and Tobago by In Labor Force | Age > 16
In terms of in labor force | age > 16, the demographic groups most similar to Immigrants from Trinidad and Tobago are Belizean (64.8%, a difference of 0.010%), Immigrants from Latin America (64.8%, a difference of 0.020%), Immigrants from Denmark (64.8%, a difference of 0.020%), Fijian (64.8%, a difference of 0.030%), and Lithuanian (64.8%, a difference of 0.040%).
| Demographics | Rating | Rank | In Labor Force | Age > 16 |
| Immigrants | Belgium | 19.4 /100 | #202 | Poor 64.9% |
| Russians | 18.8 /100 | #203 | Poor 64.9% |
| Slovenes | 18.7 /100 | #204 | Poor 64.9% |
| Jamaicans | 18.7 /100 | #205 | Poor 64.9% |
| Lithuanians | 17.4 /100 | #206 | Poor 64.8% |
| Immigrants | Latin America | 16.4 /100 | #207 | Poor 64.8% |
| Belizeans | 16.2 /100 | #208 | Poor 64.8% |
| Immigrants | Trinidad and Tobago | 15.6 /100 | #209 | Poor 64.8% |
| Immigrants | Denmark | 14.7 /100 | #210 | Poor 64.8% |
| Fijians | 14.1 /100 | #211 | Poor 64.8% |
| Alaskan Athabascans | 13.9 /100 | #212 | Poor 64.8% |
| Maltese | 13.8 /100 | #213 | Poor 64.8% |
| Estonians | 13.1 /100 | #214 | Poor 64.8% |
| Immigrants | Czechoslovakia | 12.3 /100 | #215 | Poor 64.8% |
| Belgians | 11.4 /100 | #216 | Poor 64.7% |