Chickasaw vs Immigrants from Trinidad and Tobago Disability Age 65 to 74
COMPARE
Chickasaw
Immigrants from Trinidad and Tobago
Disability Age 65 to 74
Disability Age 65 to 74 Comparison
Chickasaw
Immigrants from Trinidad and Tobago
30.2%
DISABILITY AGE 65 TO 74
0.0/ 100
METRIC RATING
331st/ 347
METRIC RANK
23.7%
DISABILITY AGE 65 TO 74
26.1/ 100
METRIC RATING
196th/ 347
METRIC RANK
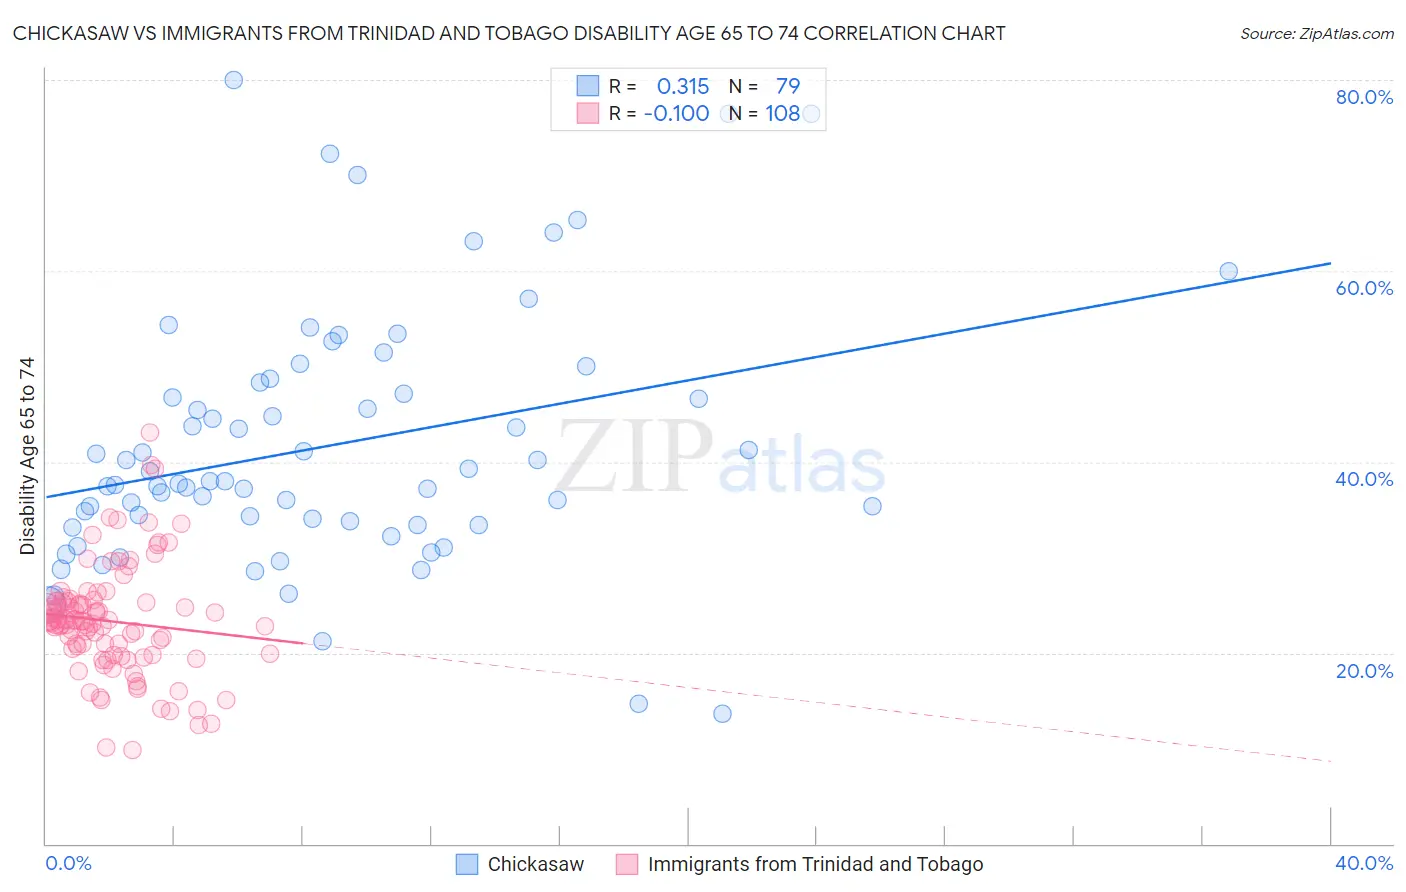
Chickasaw vs Immigrants from Trinidad and Tobago Disability Age 65 to 74 Correlation Chart
The statistical analysis conducted on geographies consisting of 147,556,011 people shows a mild positive correlation between the proportion of Chickasaw and percentage of population with a disability between the ages 65 and 75 in the United States with a correlation coefficient (R) of 0.315 and weighted average of 30.2%. Similarly, the statistical analysis conducted on geographies consisting of 223,307,816 people shows a poor negative correlation between the proportion of Immigrants from Trinidad and Tobago and percentage of population with a disability between the ages 65 and 75 in the United States with a correlation coefficient (R) of -0.100 and weighted average of 23.7%, a difference of 27.5%.
Disability Age 65 to 74 Correlation Summary
| Measurement | Chickasaw | Immigrants from Trinidad and Tobago |
| Minimum | 13.6% | 9.9% |
| Maximum | 80.0% | 43.1% |
| Range | 66.4% | 33.2% |
| Mean | 41.7% | 23.3% |
| Median | 38.0% | 23.3% |
| Interquartile 25% (IQ1) | 33.3% | 19.8% |
| Interquartile 75% (IQ3) | 48.3% | 25.3% |
| Interquartile Range (IQR) | 14.9% | 5.5% |
| Standard Deviation (Sample) | 13.4% | 5.8% |
| Standard Deviation (Population) | 13.3% | 5.8% |
Similar Demographics by Disability Age 65 to 74
Demographics Similar to Chickasaw by Disability Age 65 to 74
In terms of disability age 65 to 74, the demographic groups most similar to Chickasaw are Creek (30.2%, a difference of 0.010%), Choctaw (30.2%, a difference of 0.040%), Native/Alaskan (30.4%, a difference of 0.62%), Hopi (30.0%, a difference of 0.84%), and Colville (30.5%, a difference of 1.1%).
| Demographics | Rating | Rank | Disability Age 65 to 74 |
| Seminole | 0.0 /100 | #324 | Tragic 29.4% |
| Dutch West Indians | 0.0 /100 | #325 | Tragic 29.6% |
| Yakama | 0.0 /100 | #326 | Tragic 29.6% |
| Apache | 0.0 /100 | #327 | Tragic 29.7% |
| Hopi | 0.0 /100 | #328 | Tragic 30.0% |
| Choctaw | 0.0 /100 | #329 | Tragic 30.2% |
| Creek | 0.0 /100 | #330 | Tragic 30.2% |
| Chickasaw | 0.0 /100 | #331 | Tragic 30.2% |
| Natives/Alaskans | 0.0 /100 | #332 | Tragic 30.4% |
| Colville | 0.0 /100 | #333 | Tragic 30.5% |
| Alaska Natives | 0.0 /100 | #334 | Tragic 30.6% |
| Cheyenne | 0.0 /100 | #335 | Tragic 31.1% |
| Yuman | 0.0 /100 | #336 | Tragic 31.5% |
| Houma | 0.0 /100 | #337 | Tragic 32.3% |
| Alaskan Athabascans | 0.0 /100 | #338 | Tragic 32.4% |
Demographics Similar to Immigrants from Trinidad and Tobago by Disability Age 65 to 74
In terms of disability age 65 to 74, the demographic groups most similar to Immigrants from Trinidad and Tobago are Immigrants from St. Vincent and the Grenadines (23.7%, a difference of 0.0%), Immigrants (23.7%, a difference of 0.020%), Sudanese (23.7%, a difference of 0.13%), Immigrants from Africa (23.7%, a difference of 0.13%), and Welsh (23.7%, a difference of 0.13%).
| Demographics | Rating | Rank | Disability Age 65 to 74 |
| Scottish | 33.1 /100 | #189 | Fair 23.6% |
| Immigrants | Guyana | 31.2 /100 | #190 | Fair 23.6% |
| Immigrants | Bangladesh | 30.2 /100 | #191 | Fair 23.6% |
| Ecuadorians | 29.7 /100 | #192 | Fair 23.6% |
| English | 28.5 /100 | #193 | Fair 23.6% |
| Sudanese | 27.8 /100 | #194 | Fair 23.7% |
| Immigrants | St. Vincent and the Grenadines | 26.1 /100 | #195 | Fair 23.7% |
| Immigrants | Trinidad and Tobago | 26.1 /100 | #196 | Fair 23.7% |
| Immigrants | Immigrants | 25.8 /100 | #197 | Fair 23.7% |
| Immigrants | Africa | 24.4 /100 | #198 | Fair 23.7% |
| Welsh | 24.3 /100 | #199 | Fair 23.7% |
| French Canadians | 24.0 /100 | #200 | Fair 23.7% |
| Immigrants | Ecuador | 23.9 /100 | #201 | Fair 23.7% |
| Immigrants | Bahamas | 23.3 /100 | #202 | Fair 23.7% |
| Kenyans | 23.2 /100 | #203 | Fair 23.7% |