Chickasaw vs Turkish In Labor Force | Age 25-29
COMPARE
Chickasaw
Turkish
In Labor Force | Age 25-29
In Labor Force | Age 25-29 Comparison
Chickasaw
Turks
81.9%
IN LABOR FORCE | AGE 25-29
0.0/ 100
METRIC RATING
317th/ 347
METRIC RANK
85.6%
IN LABOR FORCE | AGE 25-29
99.8/ 100
METRIC RATING
47th/ 347
METRIC RANK
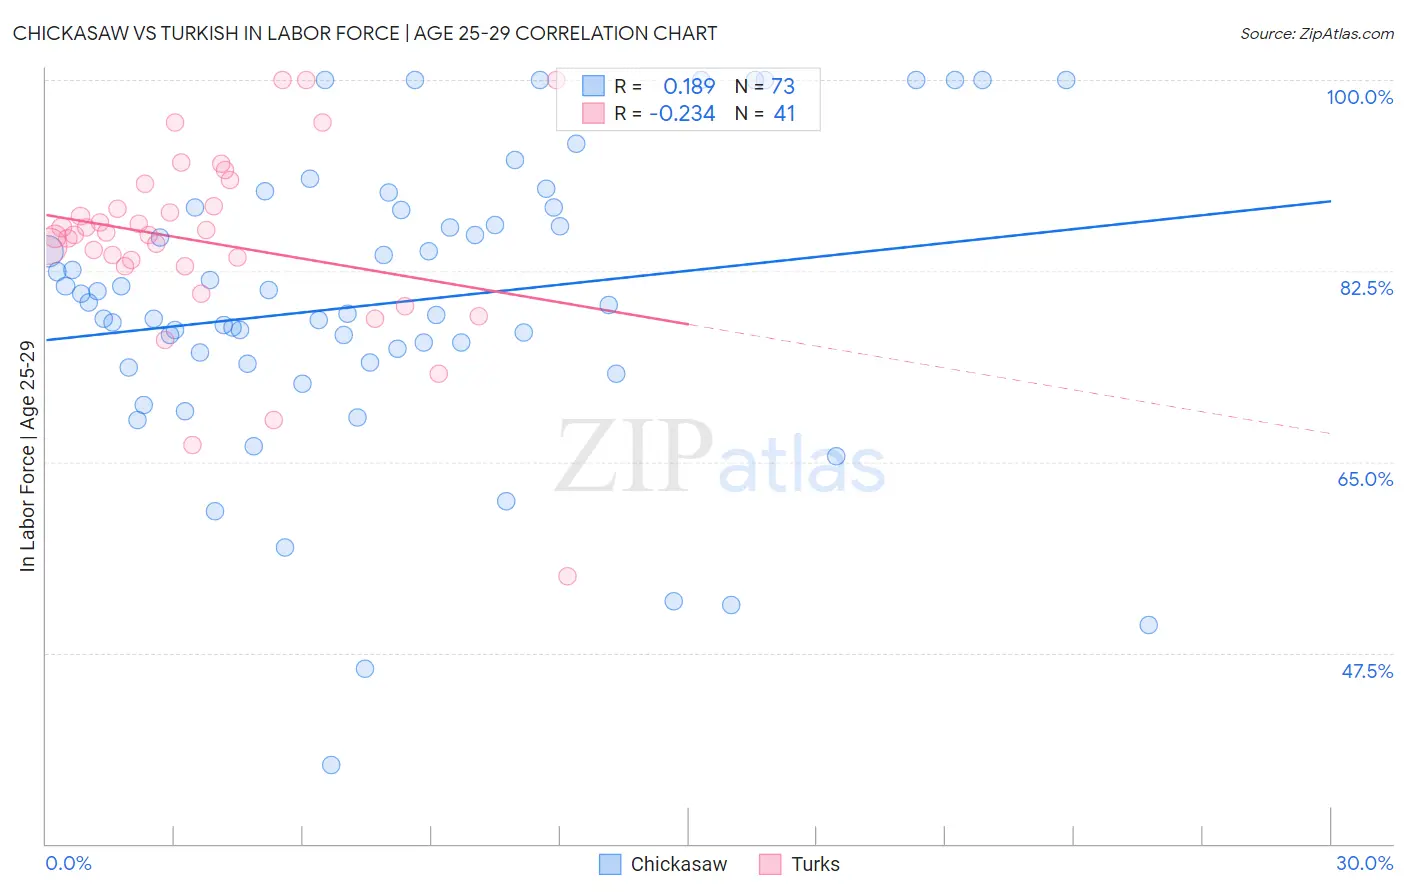
Chickasaw vs Turkish In Labor Force | Age 25-29 Correlation Chart
The statistical analysis conducted on geographies consisting of 147,700,460 people shows a poor positive correlation between the proportion of Chickasaw and labor force participation rate among population between the ages 25 and 29 in the United States with a correlation coefficient (R) of 0.189 and weighted average of 81.9%. Similarly, the statistical analysis conducted on geographies consisting of 271,804,418 people shows a weak negative correlation between the proportion of Turks and labor force participation rate among population between the ages 25 and 29 in the United States with a correlation coefficient (R) of -0.234 and weighted average of 85.6%, a difference of 4.6%.
In Labor Force | Age 25-29 Correlation Summary
| Measurement | Chickasaw | Turkish |
| Minimum | 37.2% | 54.5% |
| Maximum | 100.0% | 100.0% |
| Range | 62.8% | 45.5% |
| Mean | 79.6% | 85.1% |
| Median | 79.3% | 85.8% |
| Interquartile 25% (IQ1) | 74.0% | 82.9% |
| Interquartile 75% (IQ3) | 88.2% | 89.5% |
| Interquartile Range (IQR) | 14.2% | 6.5% |
| Standard Deviation (Sample) | 13.5% | 8.8% |
| Standard Deviation (Population) | 13.4% | 8.7% |
Similar Demographics by In Labor Force | Age 25-29
Demographics Similar to Chickasaw by In Labor Force | Age 25-29
In terms of in labor force | age 25-29, the demographic groups most similar to Chickasaw are Comanche (81.9%, a difference of 0.010%), Mexican (81.9%, a difference of 0.070%), Immigrants from Mexico (82.0%, a difference of 0.16%), Seminole (81.7%, a difference of 0.23%), and Colville (81.6%, a difference of 0.28%).
| Demographics | Rating | Rank | In Labor Force | Age 25-29 |
| Osage | 0.0 /100 | #310 | Tragic 82.3% |
| Alaskan Athabascans | 0.0 /100 | #311 | Tragic 82.3% |
| Hispanics or Latinos | 0.0 /100 | #312 | Tragic 82.2% |
| Yaqui | 0.0 /100 | #313 | Tragic 82.2% |
| Cherokee | 0.0 /100 | #314 | Tragic 82.1% |
| Immigrants | Mexico | 0.0 /100 | #315 | Tragic 82.0% |
| Mexicans | 0.0 /100 | #316 | Tragic 81.9% |
| Chickasaw | 0.0 /100 | #317 | Tragic 81.9% |
| Comanche | 0.0 /100 | #318 | Tragic 81.9% |
| Seminole | 0.0 /100 | #319 | Tragic 81.7% |
| Colville | 0.0 /100 | #320 | Tragic 81.6% |
| Shoshone | 0.0 /100 | #321 | Tragic 81.6% |
| Kiowa | 0.0 /100 | #322 | Tragic 81.6% |
| Alaska Natives | 0.0 /100 | #323 | Tragic 81.6% |
| Houma | 0.0 /100 | #324 | Tragic 81.2% |
Demographics Similar to Turks by In Labor Force | Age 25-29
In terms of in labor force | age 25-29, the demographic groups most similar to Turks are Italian (85.6%, a difference of 0.0%), Czech (85.6%, a difference of 0.020%), Swedish (85.6%, a difference of 0.020%), Yugoslavian (85.6%, a difference of 0.040%), and Immigrants from Latvia (85.6%, a difference of 0.050%).
| Demographics | Rating | Rank | In Labor Force | Age 25-29 |
| Immigrants | Albania | 99.9 /100 | #40 | Exceptional 85.7% |
| Immigrants | Greece | 99.9 /100 | #41 | Exceptional 85.7% |
| Immigrants | Eritrea | 99.9 /100 | #42 | Exceptional 85.7% |
| Immigrants | India | 99.9 /100 | #43 | Exceptional 85.7% |
| Macedonians | 99.9 /100 | #44 | Exceptional 85.7% |
| Immigrants | Sierra Leone | 99.9 /100 | #45 | Exceptional 85.7% |
| Czechs | 99.8 /100 | #46 | Exceptional 85.6% |
| Turks | 99.8 /100 | #47 | Exceptional 85.6% |
| Italians | 99.8 /100 | #48 | Exceptional 85.6% |
| Swedes | 99.8 /100 | #49 | Exceptional 85.6% |
| Yugoslavians | 99.8 /100 | #50 | Exceptional 85.6% |
| Immigrants | Latvia | 99.8 /100 | #51 | Exceptional 85.6% |
| Immigrants | Poland | 99.7 /100 | #52 | Exceptional 85.6% |
| Belgians | 99.7 /100 | #53 | Exceptional 85.5% |
| Albanians | 99.7 /100 | #54 | Exceptional 85.5% |