Finnish vs Immigrants from Portugal In Labor Force | Age 25-29
COMPARE
Finnish
Immigrants from Portugal
In Labor Force | Age 25-29
In Labor Force | Age 25-29 Comparison
Finns
Immigrants from Portugal
85.0%
IN LABOR FORCE | AGE 25-29
87.8/ 100
METRIC RATING
118th/ 347
METRIC RANK
84.6%
IN LABOR FORCE | AGE 25-29
34.7/ 100
METRIC RATING
187th/ 347
METRIC RANK
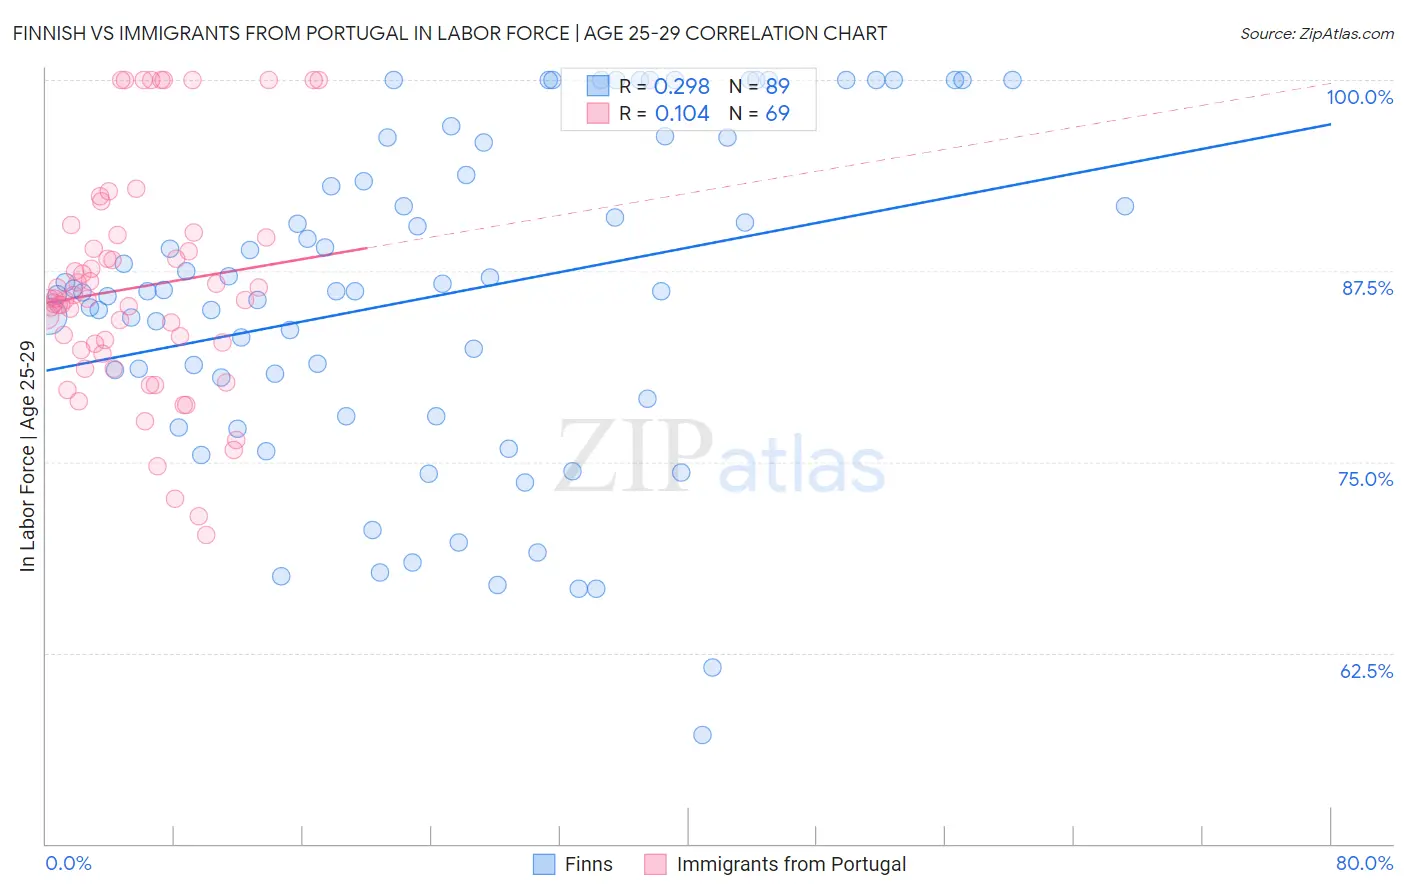
Finnish vs Immigrants from Portugal In Labor Force | Age 25-29 Correlation Chart
The statistical analysis conducted on geographies consisting of 404,431,499 people shows a weak positive correlation between the proportion of Finns and labor force participation rate among population between the ages 25 and 29 in the United States with a correlation coefficient (R) of 0.298 and weighted average of 85.0%. Similarly, the statistical analysis conducted on geographies consisting of 174,743,638 people shows a poor positive correlation between the proportion of Immigrants from Portugal and labor force participation rate among population between the ages 25 and 29 in the United States with a correlation coefficient (R) of 0.104 and weighted average of 84.6%, a difference of 0.48%.
In Labor Force | Age 25-29 Correlation Summary
| Measurement | Finnish | Immigrants from Portugal |
| Minimum | 57.1% | 70.2% |
| Maximum | 100.0% | 100.0% |
| Range | 42.9% | 29.8% |
| Mean | 85.8% | 86.4% |
| Median | 86.2% | 85.7% |
| Interquartile 25% (IQ1) | 78.6% | 82.2% |
| Interquartile 75% (IQ3) | 94.9% | 89.8% |
| Interquartile Range (IQR) | 16.3% | 7.6% |
| Standard Deviation (Sample) | 10.6% | 7.4% |
| Standard Deviation (Population) | 10.6% | 7.3% |
Similar Demographics by In Labor Force | Age 25-29
Demographics Similar to Finns by In Labor Force | Age 25-29
In terms of in labor force | age 25-29, the demographic groups most similar to Finns are Immigrants from Belarus (85.0%, a difference of 0.0%), Filipino (84.9%, a difference of 0.010%), South African (85.0%, a difference of 0.020%), Chilean (85.0%, a difference of 0.020%), and Immigrants from South Africa (84.9%, a difference of 0.030%).
| Demographics | Rating | Rank | In Labor Force | Age 25-29 |
| Immigrants | Middle Africa | 91.4 /100 | #111 | Exceptional 85.0% |
| Senegalese | 90.9 /100 | #112 | Exceptional 85.0% |
| Irish | 90.6 /100 | #113 | Exceptional 85.0% |
| Immigrants | Malaysia | 90.4 /100 | #114 | Exceptional 85.0% |
| South Africans | 88.9 /100 | #115 | Excellent 85.0% |
| Chileans | 88.8 /100 | #116 | Excellent 85.0% |
| Immigrants | Belarus | 88.0 /100 | #117 | Excellent 85.0% |
| Finns | 87.8 /100 | #118 | Excellent 85.0% |
| Filipinos | 87.1 /100 | #119 | Excellent 84.9% |
| Immigrants | South Africa | 86.1 /100 | #120 | Excellent 84.9% |
| Immigrants | Chile | 85.6 /100 | #121 | Excellent 84.9% |
| Scandinavians | 85.1 /100 | #122 | Excellent 84.9% |
| Dutch | 84.9 /100 | #123 | Excellent 84.9% |
| Immigrants | Iran | 84.8 /100 | #124 | Excellent 84.9% |
| Uruguayans | 84.7 /100 | #125 | Excellent 84.9% |
Demographics Similar to Immigrants from Portugal by In Labor Force | Age 25-29
In terms of in labor force | age 25-29, the demographic groups most similar to Immigrants from Portugal are Immigrants from Belgium (84.6%, a difference of 0.0%), Immigrants from Ukraine (84.5%, a difference of 0.010%), Immigrants from Denmark (84.6%, a difference of 0.020%), Moroccan (84.5%, a difference of 0.020%), and Immigrants from Kuwait (84.6%, a difference of 0.030%).
| Demographics | Rating | Rank | In Labor Force | Age 25-29 |
| Immigrants | South America | 42.9 /100 | #180 | Average 84.6% |
| Immigrants | Norway | 41.9 /100 | #181 | Average 84.6% |
| Europeans | 40.3 /100 | #182 | Average 84.6% |
| Scottish | 40.1 /100 | #183 | Average 84.6% |
| Immigrants | Kuwait | 38.2 /100 | #184 | Fair 84.6% |
| Immigrants | Denmark | 37.0 /100 | #185 | Fair 84.6% |
| Immigrants | Belgium | 35.0 /100 | #186 | Fair 84.6% |
| Immigrants | Portugal | 34.7 /100 | #187 | Fair 84.6% |
| Immigrants | Ukraine | 33.7 /100 | #188 | Fair 84.5% |
| Moroccans | 32.6 /100 | #189 | Fair 84.5% |
| Welsh | 31.1 /100 | #190 | Fair 84.5% |
| Zimbabweans | 28.7 /100 | #191 | Fair 84.5% |
| English | 25.8 /100 | #192 | Fair 84.5% |
| South American Indians | 25.0 /100 | #193 | Fair 84.5% |
| Portuguese | 21.2 /100 | #194 | Fair 84.4% |