Chickasaw vs Romanian In Labor Force | Age 25-29
COMPARE
Chickasaw
Romanian
In Labor Force | Age 25-29
In Labor Force | Age 25-29 Comparison
Chickasaw
Romanians
81.9%
IN LABOR FORCE | AGE 25-29
0.0/ 100
METRIC RATING
317th/ 347
METRIC RANK
84.8%
IN LABOR FORCE | AGE 25-29
77.7/ 100
METRIC RATING
132nd/ 347
METRIC RANK
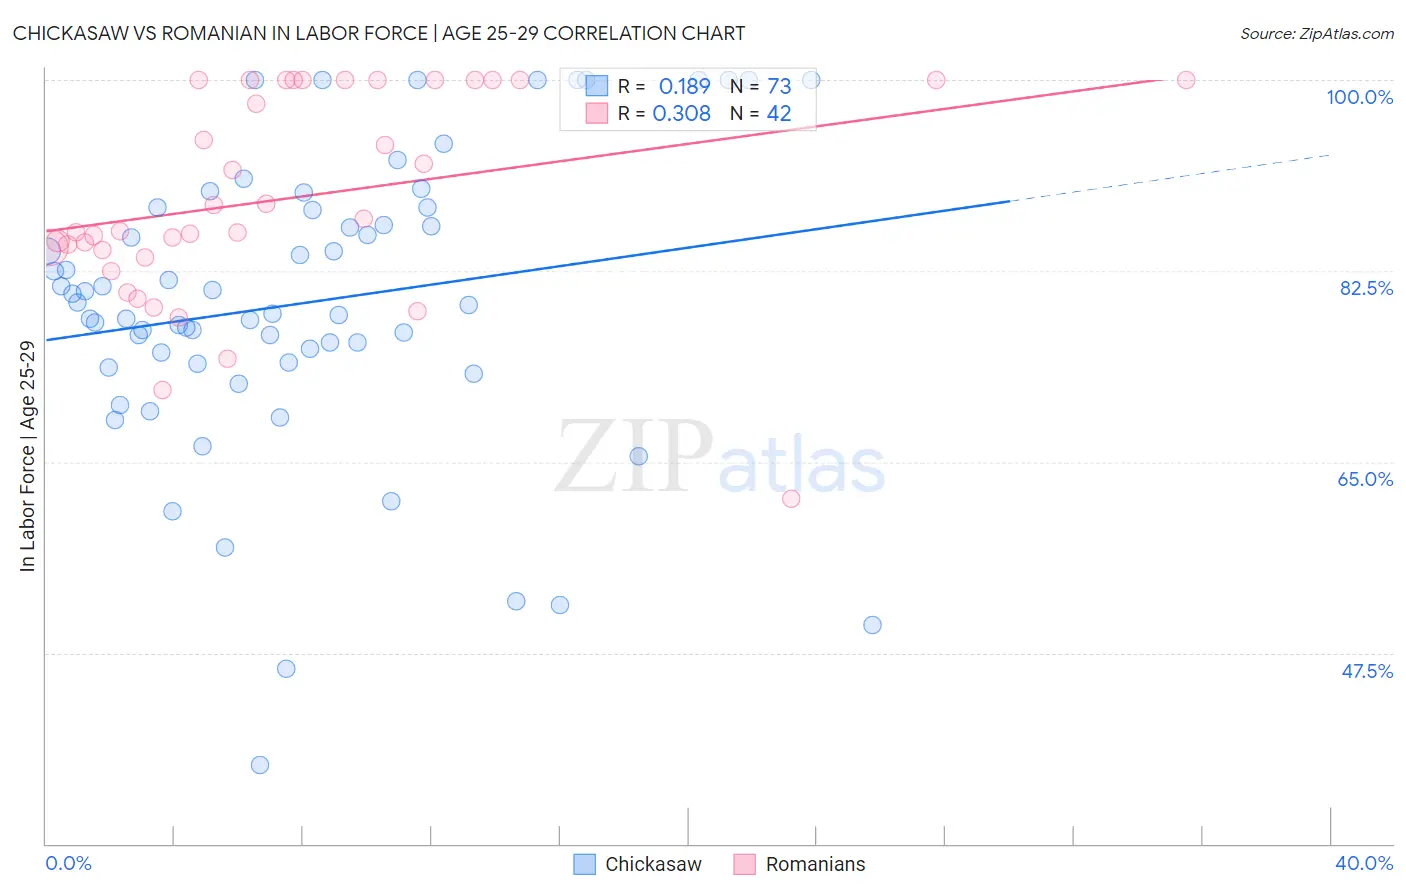
Chickasaw vs Romanian In Labor Force | Age 25-29 Correlation Chart
The statistical analysis conducted on geographies consisting of 147,700,460 people shows a poor positive correlation between the proportion of Chickasaw and labor force participation rate among population between the ages 25 and 29 in the United States with a correlation coefficient (R) of 0.189 and weighted average of 81.9%. Similarly, the statistical analysis conducted on geographies consisting of 377,759,265 people shows a mild positive correlation between the proportion of Romanians and labor force participation rate among population between the ages 25 and 29 in the United States with a correlation coefficient (R) of 0.308 and weighted average of 84.8%, a difference of 3.6%.
In Labor Force | Age 25-29 Correlation Summary
| Measurement | Chickasaw | Romanian |
| Minimum | 37.2% | 61.6% |
| Maximum | 100.0% | 100.0% |
| Range | 62.8% | 38.4% |
| Mean | 79.6% | 89.2% |
| Median | 79.3% | 86.7% |
| Interquartile 25% (IQ1) | 74.0% | 84.4% |
| Interquartile 75% (IQ3) | 88.2% | 100.0% |
| Interquartile Range (IQR) | 14.2% | 15.6% |
| Standard Deviation (Sample) | 13.5% | 9.5% |
| Standard Deviation (Population) | 13.4% | 9.4% |
Similar Demographics by In Labor Force | Age 25-29
Demographics Similar to Chickasaw by In Labor Force | Age 25-29
In terms of in labor force | age 25-29, the demographic groups most similar to Chickasaw are Comanche (81.9%, a difference of 0.010%), Mexican (81.9%, a difference of 0.070%), Immigrants from Mexico (82.0%, a difference of 0.16%), Seminole (81.7%, a difference of 0.23%), and Colville (81.6%, a difference of 0.28%).
| Demographics | Rating | Rank | In Labor Force | Age 25-29 |
| Osage | 0.0 /100 | #310 | Tragic 82.3% |
| Alaskan Athabascans | 0.0 /100 | #311 | Tragic 82.3% |
| Hispanics or Latinos | 0.0 /100 | #312 | Tragic 82.2% |
| Yaqui | 0.0 /100 | #313 | Tragic 82.2% |
| Cherokee | 0.0 /100 | #314 | Tragic 82.1% |
| Immigrants | Mexico | 0.0 /100 | #315 | Tragic 82.0% |
| Mexicans | 0.0 /100 | #316 | Tragic 81.9% |
| Chickasaw | 0.0 /100 | #317 | Tragic 81.9% |
| Comanche | 0.0 /100 | #318 | Tragic 81.9% |
| Seminole | 0.0 /100 | #319 | Tragic 81.7% |
| Colville | 0.0 /100 | #320 | Tragic 81.6% |
| Shoshone | 0.0 /100 | #321 | Tragic 81.6% |
| Kiowa | 0.0 /100 | #322 | Tragic 81.6% |
| Alaska Natives | 0.0 /100 | #323 | Tragic 81.6% |
| Houma | 0.0 /100 | #324 | Tragic 81.2% |
Demographics Similar to Romanians by In Labor Force | Age 25-29
In terms of in labor force | age 25-29, the demographic groups most similar to Romanians are Iranian (84.8%, a difference of 0.0%), Asian (84.8%, a difference of 0.0%), Syrian (84.8%, a difference of 0.010%), Immigrants from Hungary (84.8%, a difference of 0.010%), and Bhutanese (84.8%, a difference of 0.020%).
| Demographics | Rating | Rank | In Labor Force | Age 25-29 |
| Uruguayans | 84.7 /100 | #125 | Excellent 84.9% |
| Immigrants | Singapore | 84.4 /100 | #126 | Excellent 84.9% |
| Immigrants | Uruguay | 84.0 /100 | #127 | Excellent 84.9% |
| Australians | 83.6 /100 | #128 | Excellent 84.9% |
| Immigrants | Russia | 81.6 /100 | #129 | Excellent 84.9% |
| Northern Europeans | 81.3 /100 | #130 | Excellent 84.9% |
| Iranians | 78.1 /100 | #131 | Good 84.8% |
| Romanians | 77.7 /100 | #132 | Good 84.8% |
| Asians | 77.7 /100 | #133 | Good 84.8% |
| Syrians | 76.5 /100 | #134 | Good 84.8% |
| Immigrants | Hungary | 76.4 /100 | #135 | Good 84.8% |
| Bhutanese | 76.0 /100 | #136 | Good 84.8% |
| Immigrants | Canada | 73.5 /100 | #137 | Good 84.8% |
| Armenians | 72.7 /100 | #138 | Good 84.8% |
| Immigrants | Eastern Asia | 72.6 /100 | #139 | Good 84.8% |