Immigrants from Yemen vs Immigrants from Portugal In Labor Force | Age 25-29
COMPARE
Immigrants from Yemen
Immigrants from Portugal
In Labor Force | Age 25-29
In Labor Force | Age 25-29 Comparison
Immigrants from Yemen
Immigrants from Portugal
78.2%
IN LABOR FORCE | AGE 25-29
0.0/ 100
METRIC RATING
339th/ 347
METRIC RANK
84.6%
IN LABOR FORCE | AGE 25-29
34.7/ 100
METRIC RATING
187th/ 347
METRIC RANK
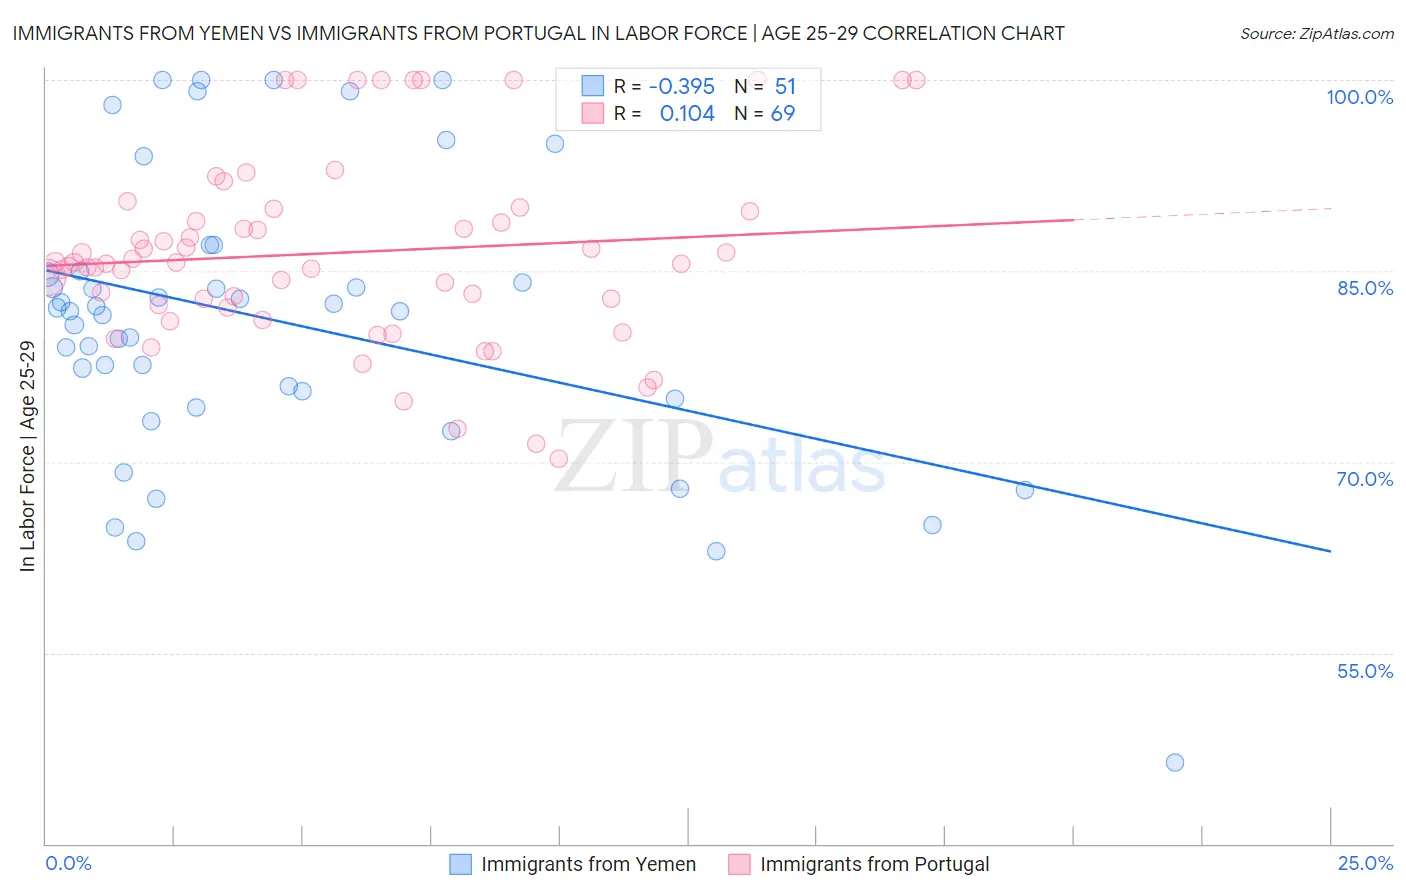
Immigrants from Yemen vs Immigrants from Portugal In Labor Force | Age 25-29 Correlation Chart
The statistical analysis conducted on geographies consisting of 82,433,611 people shows a mild negative correlation between the proportion of Immigrants from Yemen and labor force participation rate among population between the ages 25 and 29 in the United States with a correlation coefficient (R) of -0.395 and weighted average of 78.2%. Similarly, the statistical analysis conducted on geographies consisting of 174,743,638 people shows a poor positive correlation between the proportion of Immigrants from Portugal and labor force participation rate among population between the ages 25 and 29 in the United States with a correlation coefficient (R) of 0.104 and weighted average of 84.6%, a difference of 8.1%.
In Labor Force | Age 25-29 Correlation Summary
| Measurement | Immigrants from Yemen | Immigrants from Portugal |
| Minimum | 46.4% | 70.2% |
| Maximum | 100.0% | 100.0% |
| Range | 53.6% | 29.8% |
| Mean | 81.1% | 86.4% |
| Median | 81.9% | 85.7% |
| Interquartile 25% (IQ1) | 75.0% | 82.2% |
| Interquartile 75% (IQ3) | 85.0% | 89.8% |
| Interquartile Range (IQR) | 10.0% | 7.6% |
| Standard Deviation (Sample) | 11.4% | 7.4% |
| Standard Deviation (Population) | 11.2% | 7.3% |
Similar Demographics by In Labor Force | Age 25-29
Demographics Similar to Immigrants from Yemen by In Labor Force | Age 25-29
In terms of in labor force | age 25-29, the demographic groups most similar to Immigrants from Yemen are Lumbee (78.3%, a difference of 0.12%), Paiute (78.1%, a difference of 0.16%), Crow (78.6%, a difference of 0.49%), Tohono O'odham (77.5%, a difference of 0.94%), and Pueblo (77.5%, a difference of 0.96%).
| Demographics | Rating | Rank | In Labor Force | Age 25-29 |
| Inupiat | 0.0 /100 | #332 | Tragic 79.8% |
| Sioux | 0.0 /100 | #333 | Tragic 79.7% |
| Yuman | 0.0 /100 | #334 | Tragic 79.3% |
| Natives/Alaskans | 0.0 /100 | #335 | Tragic 79.3% |
| Apache | 0.0 /100 | #336 | Tragic 79.2% |
| Crow | 0.0 /100 | #337 | Tragic 78.6% |
| Lumbee | 0.0 /100 | #338 | Tragic 78.3% |
| Immigrants | Yemen | 0.0 /100 | #339 | Tragic 78.2% |
| Paiute | 0.0 /100 | #340 | Tragic 78.1% |
| Tohono O'odham | 0.0 /100 | #341 | Tragic 77.5% |
| Pueblo | 0.0 /100 | #342 | Tragic 77.5% |
| Arapaho | 0.0 /100 | #343 | Tragic 76.6% |
| Hopi | 0.0 /100 | #344 | Tragic 76.5% |
| Navajo | 0.0 /100 | #345 | Tragic 74.6% |
| Pima | 0.0 /100 | #346 | Tragic 74.3% |
Demographics Similar to Immigrants from Portugal by In Labor Force | Age 25-29
In terms of in labor force | age 25-29, the demographic groups most similar to Immigrants from Portugal are Immigrants from Belgium (84.6%, a difference of 0.0%), Immigrants from Ukraine (84.5%, a difference of 0.010%), Immigrants from Denmark (84.6%, a difference of 0.020%), Moroccan (84.5%, a difference of 0.020%), and Immigrants from Kuwait (84.6%, a difference of 0.030%).
| Demographics | Rating | Rank | In Labor Force | Age 25-29 |
| Immigrants | South America | 42.9 /100 | #180 | Average 84.6% |
| Immigrants | Norway | 41.9 /100 | #181 | Average 84.6% |
| Europeans | 40.3 /100 | #182 | Average 84.6% |
| Scottish | 40.1 /100 | #183 | Average 84.6% |
| Immigrants | Kuwait | 38.2 /100 | #184 | Fair 84.6% |
| Immigrants | Denmark | 37.0 /100 | #185 | Fair 84.6% |
| Immigrants | Belgium | 35.0 /100 | #186 | Fair 84.6% |
| Immigrants | Portugal | 34.7 /100 | #187 | Fair 84.6% |
| Immigrants | Ukraine | 33.7 /100 | #188 | Fair 84.5% |
| Moroccans | 32.6 /100 | #189 | Fair 84.5% |
| Welsh | 31.1 /100 | #190 | Fair 84.5% |
| Zimbabweans | 28.7 /100 | #191 | Fair 84.5% |
| English | 25.8 /100 | #192 | Fair 84.5% |
| South American Indians | 25.0 /100 | #193 | Fair 84.5% |
| Portuguese | 21.2 /100 | #194 | Fair 84.4% |