Chickasaw vs Creek In Labor Force | Age 25-29
COMPARE
Chickasaw
Creek
In Labor Force | Age 25-29
In Labor Force | Age 25-29 Comparison
Chickasaw
Creek
81.9%
IN LABOR FORCE | AGE 25-29
0.0/ 100
METRIC RATING
317th/ 347
METRIC RANK
80.7%
IN LABOR FORCE | AGE 25-29
0.0/ 100
METRIC RATING
328th/ 347
METRIC RANK
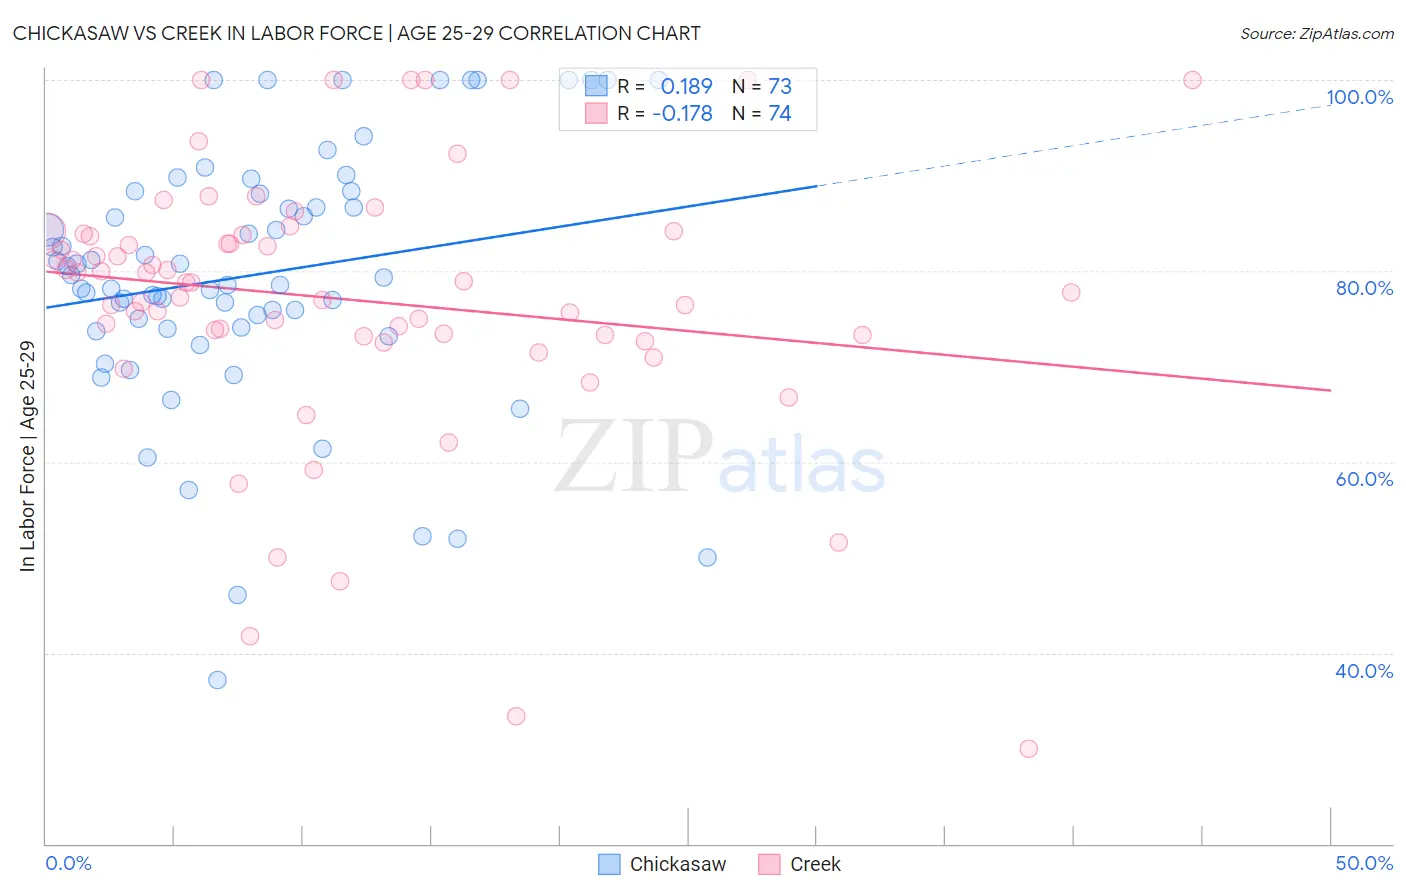
Chickasaw vs Creek In Labor Force | Age 25-29 Correlation Chart
The statistical analysis conducted on geographies consisting of 147,700,460 people shows a poor positive correlation between the proportion of Chickasaw and labor force participation rate among population between the ages 25 and 29 in the United States with a correlation coefficient (R) of 0.189 and weighted average of 81.9%. Similarly, the statistical analysis conducted on geographies consisting of 178,425,727 people shows a poor negative correlation between the proportion of Creek and labor force participation rate among population between the ages 25 and 29 in the United States with a correlation coefficient (R) of -0.178 and weighted average of 80.7%, a difference of 1.5%.
In Labor Force | Age 25-29 Correlation Summary
| Measurement | Chickasaw | Creek |
| Minimum | 37.2% | 30.0% |
| Maximum | 100.0% | 100.0% |
| Range | 62.8% | 70.0% |
| Mean | 79.6% | 77.0% |
| Median | 79.3% | 78.8% |
| Interquartile 25% (IQ1) | 74.0% | 73.3% |
| Interquartile 75% (IQ3) | 88.2% | 83.8% |
| Interquartile Range (IQR) | 14.2% | 10.5% |
| Standard Deviation (Sample) | 13.5% | 14.1% |
| Standard Deviation (Population) | 13.4% | 14.0% |
Demographics Similar to Chickasaw and Creek by In Labor Force | Age 25-29
In terms of in labor force | age 25-29, the demographic groups most similar to Chickasaw are Comanche (81.9%, a difference of 0.010%), Mexican (81.9%, a difference of 0.070%), Immigrants from Mexico (82.0%, a difference of 0.16%), Seminole (81.7%, a difference of 0.23%), and Colville (81.6%, a difference of 0.28%). Similarly, the demographic groups most similar to Creek are Yakama (80.6%, a difference of 0.11%), Ute (80.8%, a difference of 0.15%), Puerto Rican (80.4%, a difference of 0.34%), Choctaw (81.0%, a difference of 0.35%), and Cheyenne (80.3%, a difference of 0.48%).
| Demographics | Rating | Rank | In Labor Force | Age 25-29 |
| Hispanics or Latinos | 0.0 /100 | #312 | Tragic 82.2% |
| Yaqui | 0.0 /100 | #313 | Tragic 82.2% |
| Cherokee | 0.0 /100 | #314 | Tragic 82.1% |
| Immigrants | Mexico | 0.0 /100 | #315 | Tragic 82.0% |
| Mexicans | 0.0 /100 | #316 | Tragic 81.9% |
| Chickasaw | 0.0 /100 | #317 | Tragic 81.9% |
| Comanche | 0.0 /100 | #318 | Tragic 81.9% |
| Seminole | 0.0 /100 | #319 | Tragic 81.7% |
| Colville | 0.0 /100 | #320 | Tragic 81.6% |
| Shoshone | 0.0 /100 | #321 | Tragic 81.6% |
| Kiowa | 0.0 /100 | #322 | Tragic 81.6% |
| Alaska Natives | 0.0 /100 | #323 | Tragic 81.6% |
| Houma | 0.0 /100 | #324 | Tragic 81.2% |
| Dutch West Indians | 0.0 /100 | #325 | Tragic 81.1% |
| Choctaw | 0.0 /100 | #326 | Tragic 81.0% |
| Ute | 0.0 /100 | #327 | Tragic 80.8% |
| Creek | 0.0 /100 | #328 | Tragic 80.7% |
| Yakama | 0.0 /100 | #329 | Tragic 80.6% |
| Puerto Ricans | 0.0 /100 | #330 | Tragic 80.4% |
| Cheyenne | 0.0 /100 | #331 | Tragic 80.3% |
| Inupiat | 0.0 /100 | #332 | Tragic 79.8% |