Pennsylvania German vs Immigrants from Portugal In Labor Force | Age 25-29
COMPARE
Pennsylvania German
Immigrants from Portugal
In Labor Force | Age 25-29
In Labor Force | Age 25-29 Comparison
Pennsylvania Germans
Immigrants from Portugal
83.6%
IN LABOR FORCE | AGE 25-29
0.1/ 100
METRIC RATING
261st/ 347
METRIC RANK
84.6%
IN LABOR FORCE | AGE 25-29
34.7/ 100
METRIC RATING
187th/ 347
METRIC RANK
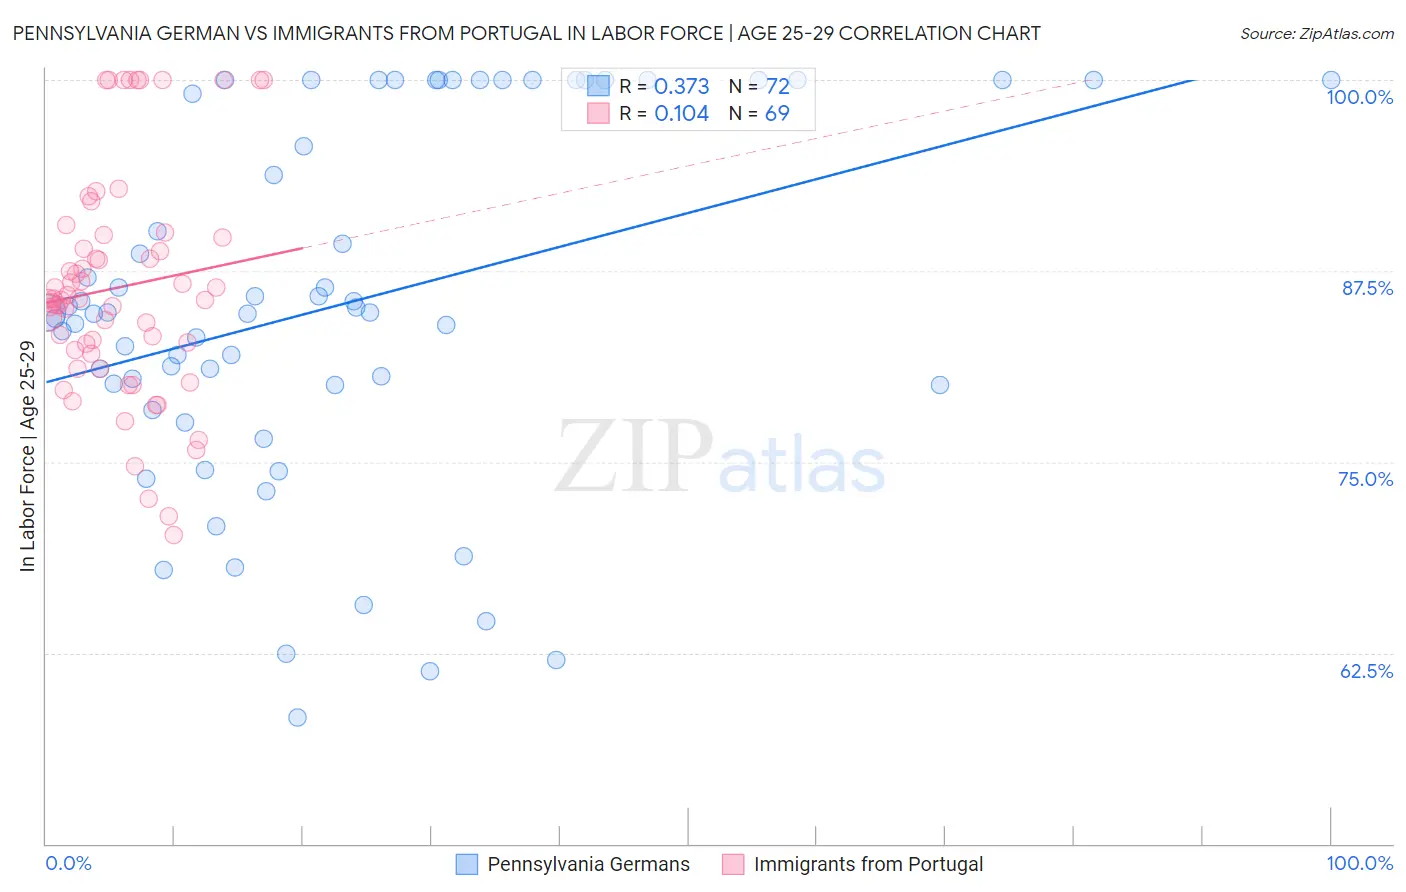
Pennsylvania German vs Immigrants from Portugal In Labor Force | Age 25-29 Correlation Chart
The statistical analysis conducted on geographies consisting of 234,004,044 people shows a mild positive correlation between the proportion of Pennsylvania Germans and labor force participation rate among population between the ages 25 and 29 in the United States with a correlation coefficient (R) of 0.373 and weighted average of 83.6%. Similarly, the statistical analysis conducted on geographies consisting of 174,743,638 people shows a poor positive correlation between the proportion of Immigrants from Portugal and labor force participation rate among population between the ages 25 and 29 in the United States with a correlation coefficient (R) of 0.104 and weighted average of 84.6%, a difference of 1.1%.
In Labor Force | Age 25-29 Correlation Summary
| Measurement | Pennsylvania German | Immigrants from Portugal |
| Minimum | 58.3% | 70.2% |
| Maximum | 100.0% | 100.0% |
| Range | 41.7% | 29.8% |
| Mean | 85.3% | 86.4% |
| Median | 84.8% | 85.7% |
| Interquartile 25% (IQ1) | 80.0% | 82.2% |
| Interquartile 75% (IQ3) | 100.0% | 89.8% |
| Interquartile Range (IQR) | 20.0% | 7.6% |
| Standard Deviation (Sample) | 11.7% | 7.4% |
| Standard Deviation (Population) | 11.6% | 7.3% |
Similar Demographics by In Labor Force | Age 25-29
Demographics Similar to Pennsylvania Germans by In Labor Force | Age 25-29
In terms of in labor force | age 25-29, the demographic groups most similar to Pennsylvania Germans are Immigrants from Bahamas (83.6%, a difference of 0.0%), Spanish (83.6%, a difference of 0.010%), Immigrants from Guatemala (83.6%, a difference of 0.020%), Delaware (83.7%, a difference of 0.060%), and Immigrants from Fiji (83.6%, a difference of 0.060%).
| Demographics | Rating | Rank | In Labor Force | Age 25-29 |
| Spaniards | 0.2 /100 | #254 | Tragic 83.7% |
| Haitians | 0.2 /100 | #255 | Tragic 83.7% |
| Immigrants | Haiti | 0.2 /100 | #256 | Tragic 83.7% |
| Delaware | 0.2 /100 | #257 | Tragic 83.7% |
| Immigrants | Guatemala | 0.1 /100 | #258 | Tragic 83.6% |
| Spanish | 0.1 /100 | #259 | Tragic 83.6% |
| Immigrants | Bahamas | 0.1 /100 | #260 | Tragic 83.6% |
| Pennsylvania Germans | 0.1 /100 | #261 | Tragic 83.6% |
| Immigrants | Fiji | 0.1 /100 | #262 | Tragic 83.6% |
| West Indians | 0.1 /100 | #263 | Tragic 83.5% |
| Puget Sound Salish | 0.1 /100 | #264 | Tragic 83.5% |
| Cubans | 0.1 /100 | #265 | Tragic 83.5% |
| Aleuts | 0.0 /100 | #266 | Tragic 83.4% |
| Spanish Americans | 0.0 /100 | #267 | Tragic 83.4% |
| Immigrants | Lebanon | 0.0 /100 | #268 | Tragic 83.4% |
Demographics Similar to Immigrants from Portugal by In Labor Force | Age 25-29
In terms of in labor force | age 25-29, the demographic groups most similar to Immigrants from Portugal are Immigrants from Belgium (84.6%, a difference of 0.0%), Immigrants from Ukraine (84.5%, a difference of 0.010%), Immigrants from Denmark (84.6%, a difference of 0.020%), Moroccan (84.5%, a difference of 0.020%), and Immigrants from Kuwait (84.6%, a difference of 0.030%).
| Demographics | Rating | Rank | In Labor Force | Age 25-29 |
| Immigrants | South America | 42.9 /100 | #180 | Average 84.6% |
| Immigrants | Norway | 41.9 /100 | #181 | Average 84.6% |
| Europeans | 40.3 /100 | #182 | Average 84.6% |
| Scottish | 40.1 /100 | #183 | Average 84.6% |
| Immigrants | Kuwait | 38.2 /100 | #184 | Fair 84.6% |
| Immigrants | Denmark | 37.0 /100 | #185 | Fair 84.6% |
| Immigrants | Belgium | 35.0 /100 | #186 | Fair 84.6% |
| Immigrants | Portugal | 34.7 /100 | #187 | Fair 84.6% |
| Immigrants | Ukraine | 33.7 /100 | #188 | Fair 84.5% |
| Moroccans | 32.6 /100 | #189 | Fair 84.5% |
| Welsh | 31.1 /100 | #190 | Fair 84.5% |
| Zimbabweans | 28.7 /100 | #191 | Fair 84.5% |
| English | 25.8 /100 | #192 | Fair 84.5% |
| South American Indians | 25.0 /100 | #193 | Fair 84.5% |
| Portuguese | 21.2 /100 | #194 | Fair 84.4% |