Chickasaw vs Immigrants from Czechoslovakia In Labor Force | Age 25-29
COMPARE
Chickasaw
Immigrants from Czechoslovakia
In Labor Force | Age 25-29
In Labor Force | Age 25-29 Comparison
Chickasaw
Immigrants from Czechoslovakia
81.9%
IN LABOR FORCE | AGE 25-29
0.0/ 100
METRIC RATING
317th/ 347
METRIC RANK
85.4%
IN LABOR FORCE | AGE 25-29
99.3/ 100
METRIC RATING
65th/ 347
METRIC RANK
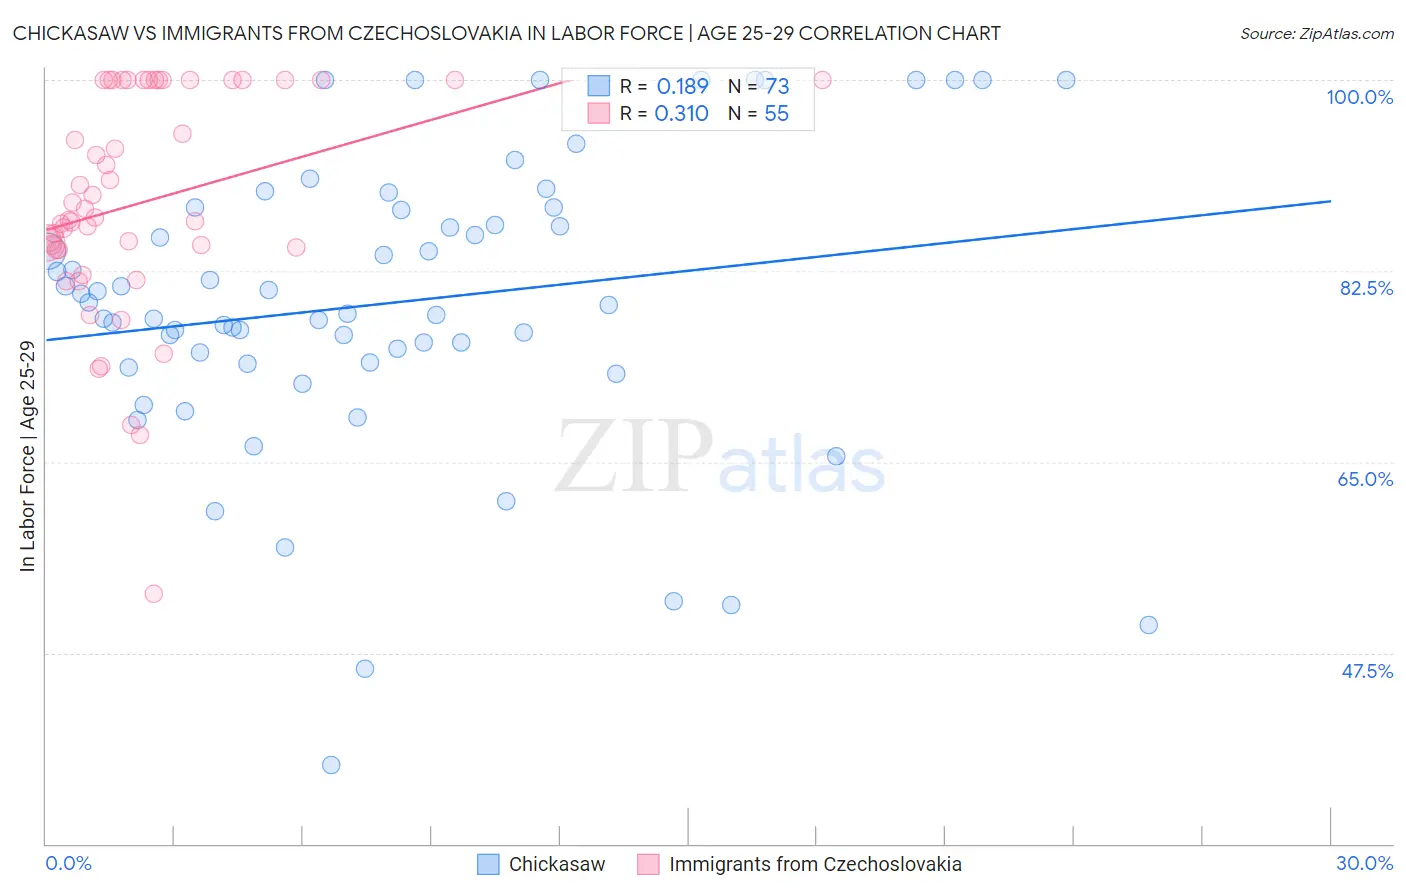
Chickasaw vs Immigrants from Czechoslovakia In Labor Force | Age 25-29 Correlation Chart
The statistical analysis conducted on geographies consisting of 147,700,460 people shows a poor positive correlation between the proportion of Chickasaw and labor force participation rate among population between the ages 25 and 29 in the United States with a correlation coefficient (R) of 0.189 and weighted average of 81.9%. Similarly, the statistical analysis conducted on geographies consisting of 195,420,999 people shows a mild positive correlation between the proportion of Immigrants from Czechoslovakia and labor force participation rate among population between the ages 25 and 29 in the United States with a correlation coefficient (R) of 0.310 and weighted average of 85.4%, a difference of 4.3%.
In Labor Force | Age 25-29 Correlation Summary
| Measurement | Chickasaw | Immigrants from Czechoslovakia |
| Minimum | 37.2% | 52.9% |
| Maximum | 100.0% | 100.0% |
| Range | 62.8% | 47.1% |
| Mean | 79.6% | 88.8% |
| Median | 79.3% | 87.4% |
| Interquartile 25% (IQ1) | 74.0% | 84.4% |
| Interquartile 75% (IQ3) | 88.2% | 100.0% |
| Interquartile Range (IQR) | 14.2% | 15.6% |
| Standard Deviation (Sample) | 13.5% | 10.2% |
| Standard Deviation (Population) | 13.4% | 10.1% |
Similar Demographics by In Labor Force | Age 25-29
Demographics Similar to Chickasaw by In Labor Force | Age 25-29
In terms of in labor force | age 25-29, the demographic groups most similar to Chickasaw are Comanche (81.9%, a difference of 0.010%), Mexican (81.9%, a difference of 0.070%), Immigrants from Mexico (82.0%, a difference of 0.16%), Seminole (81.7%, a difference of 0.23%), and Colville (81.6%, a difference of 0.28%).
| Demographics | Rating | Rank | In Labor Force | Age 25-29 |
| Osage | 0.0 /100 | #310 | Tragic 82.3% |
| Alaskan Athabascans | 0.0 /100 | #311 | Tragic 82.3% |
| Hispanics or Latinos | 0.0 /100 | #312 | Tragic 82.2% |
| Yaqui | 0.0 /100 | #313 | Tragic 82.2% |
| Cherokee | 0.0 /100 | #314 | Tragic 82.1% |
| Immigrants | Mexico | 0.0 /100 | #315 | Tragic 82.0% |
| Mexicans | 0.0 /100 | #316 | Tragic 81.9% |
| Chickasaw | 0.0 /100 | #317 | Tragic 81.9% |
| Comanche | 0.0 /100 | #318 | Tragic 81.9% |
| Seminole | 0.0 /100 | #319 | Tragic 81.7% |
| Colville | 0.0 /100 | #320 | Tragic 81.6% |
| Shoshone | 0.0 /100 | #321 | Tragic 81.6% |
| Kiowa | 0.0 /100 | #322 | Tragic 81.6% |
| Alaska Natives | 0.0 /100 | #323 | Tragic 81.6% |
| Houma | 0.0 /100 | #324 | Tragic 81.2% |
Demographics Similar to Immigrants from Czechoslovakia by In Labor Force | Age 25-29
In terms of in labor force | age 25-29, the demographic groups most similar to Immigrants from Czechoslovakia are Immigrants from Italy (85.4%, a difference of 0.010%), Immigrants from Scotland (85.4%, a difference of 0.010%), Immigrants from Turkey (85.4%, a difference of 0.020%), Immigrants from Cameroon (85.4%, a difference of 0.020%), and Taiwanese (85.4%, a difference of 0.030%).
| Demographics | Rating | Rank | In Labor Force | Age 25-29 |
| Greeks | 99.6 /100 | #58 | Exceptional 85.5% |
| Immigrants | Morocco | 99.5 /100 | #59 | Exceptional 85.5% |
| Thais | 99.5 /100 | #60 | Exceptional 85.5% |
| Serbians | 99.5 /100 | #61 | Exceptional 85.5% |
| Taiwanese | 99.4 /100 | #62 | Exceptional 85.4% |
| Immigrants | Kenya | 99.4 /100 | #63 | Exceptional 85.4% |
| Immigrants | Italy | 99.3 /100 | #64 | Exceptional 85.4% |
| Immigrants | Czechoslovakia | 99.3 /100 | #65 | Exceptional 85.4% |
| Immigrants | Scotland | 99.3 /100 | #66 | Exceptional 85.4% |
| Immigrants | Turkey | 99.2 /100 | #67 | Exceptional 85.4% |
| Immigrants | Cameroon | 99.2 /100 | #68 | Exceptional 85.4% |
| Menominee | 99.1 /100 | #69 | Exceptional 85.4% |
| Immigrants | Sweden | 99.1 /100 | #70 | Exceptional 85.4% |
| Kenyans | 99.0 /100 | #71 | Exceptional 85.4% |
| Immigrants | Australia | 98.9 /100 | #72 | Exceptional 85.3% |