Ukrainian vs Immigrants from Portugal In Labor Force | Age 25-29
COMPARE
Ukrainian
Immigrants from Portugal
In Labor Force | Age 25-29
In Labor Force | Age 25-29 Comparison
Ukrainians
Immigrants from Portugal
85.2%
IN LABOR FORCE | AGE 25-29
96.7/ 100
METRIC RATING
86th/ 347
METRIC RANK
84.6%
IN LABOR FORCE | AGE 25-29
34.7/ 100
METRIC RATING
187th/ 347
METRIC RANK
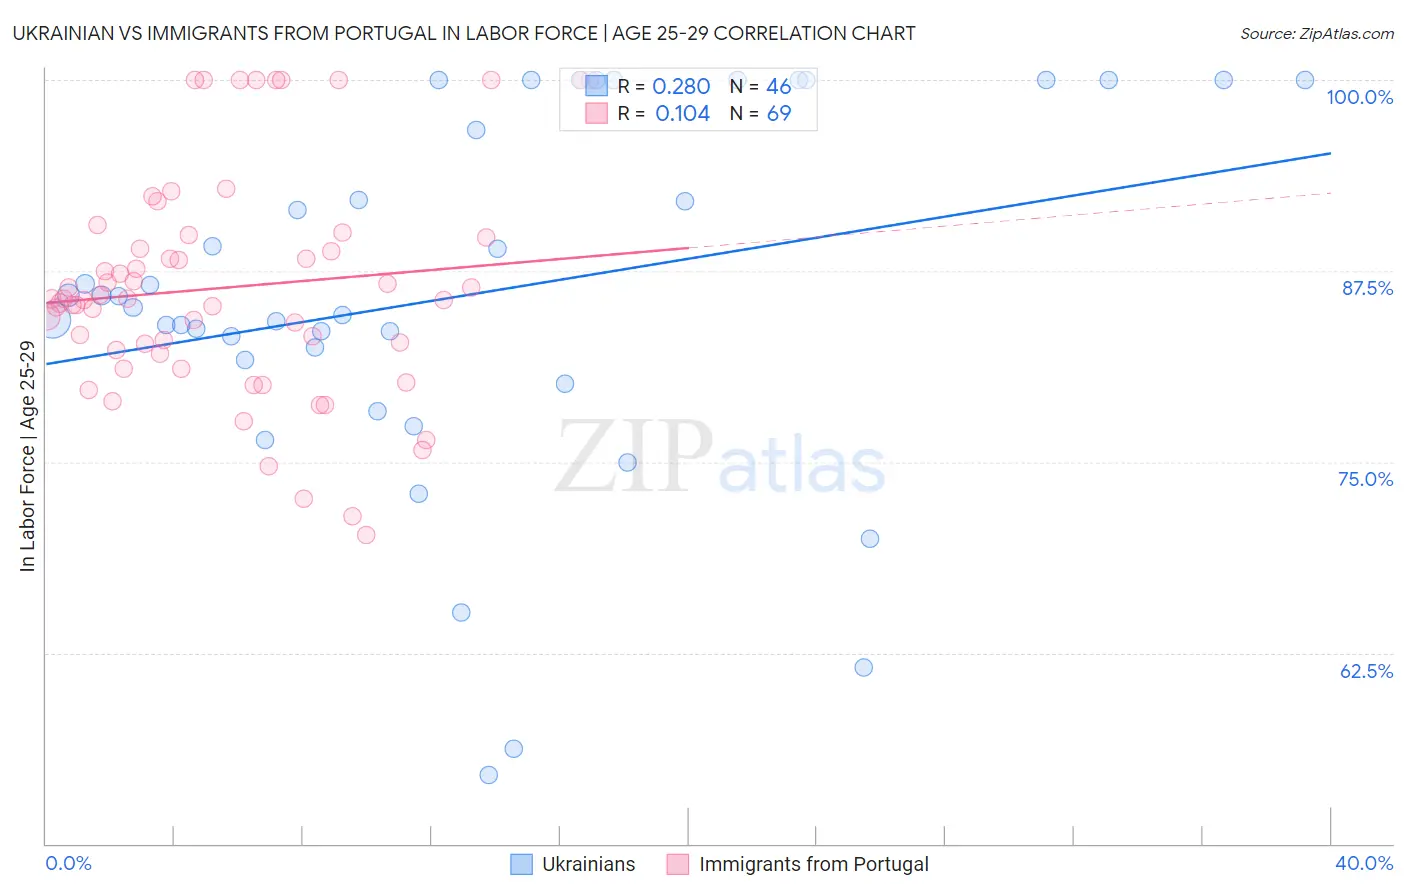
Ukrainian vs Immigrants from Portugal In Labor Force | Age 25-29 Correlation Chart
The statistical analysis conducted on geographies consisting of 448,388,747 people shows a weak positive correlation between the proportion of Ukrainians and labor force participation rate among population between the ages 25 and 29 in the United States with a correlation coefficient (R) of 0.280 and weighted average of 85.2%. Similarly, the statistical analysis conducted on geographies consisting of 174,743,638 people shows a poor positive correlation between the proportion of Immigrants from Portugal and labor force participation rate among population between the ages 25 and 29 in the United States with a correlation coefficient (R) of 0.104 and weighted average of 84.6%, a difference of 0.74%.
In Labor Force | Age 25-29 Correlation Summary
| Measurement | Ukrainian | Immigrants from Portugal |
| Minimum | 54.5% | 70.2% |
| Maximum | 100.0% | 100.0% |
| Range | 45.5% | 29.8% |
| Mean | 85.9% | 86.4% |
| Median | 85.5% | 85.7% |
| Interquartile 25% (IQ1) | 81.7% | 82.2% |
| Interquartile 75% (IQ3) | 100.0% | 89.8% |
| Interquartile Range (IQR) | 18.3% | 7.6% |
| Standard Deviation (Sample) | 11.9% | 7.4% |
| Standard Deviation (Population) | 11.8% | 7.3% |
Similar Demographics by In Labor Force | Age 25-29
Demographics Similar to Ukrainians by In Labor Force | Age 25-29
In terms of in labor force | age 25-29, the demographic groups most similar to Ukrainians are Immigrants from Africa (85.2%, a difference of 0.0%), Immigrants from Europe (85.2%, a difference of 0.010%), Immigrants from Eastern Europe (85.2%, a difference of 0.010%), French Canadian (85.2%, a difference of 0.010%), and Immigrants from Croatia (85.2%, a difference of 0.010%).
| Demographics | Rating | Rank | In Labor Force | Age 25-29 |
| Immigrants | Northern Africa | 97.6 /100 | #79 | Exceptional 85.2% |
| Immigrants | Zimbabwe | 97.6 /100 | #80 | Exceptional 85.2% |
| Immigrants | Northern Europe | 97.2 /100 | #81 | Exceptional 85.2% |
| Okinawans | 97.0 /100 | #82 | Exceptional 85.2% |
| Immigrants | Europe | 96.8 /100 | #83 | Exceptional 85.2% |
| Immigrants | Eastern Europe | 96.8 /100 | #84 | Exceptional 85.2% |
| Immigrants | Africa | 96.7 /100 | #85 | Exceptional 85.2% |
| Ukrainians | 96.7 /100 | #86 | Exceptional 85.2% |
| French Canadians | 96.5 /100 | #87 | Exceptional 85.2% |
| Immigrants | Croatia | 96.4 /100 | #88 | Exceptional 85.2% |
| Immigrants | France | 96.3 /100 | #89 | Exceptional 85.2% |
| Burmese | 95.9 /100 | #90 | Exceptional 85.1% |
| Immigrants | Moldova | 95.8 /100 | #91 | Exceptional 85.1% |
| Immigrants | Costa Rica | 95.5 /100 | #92 | Exceptional 85.1% |
| Austrians | 95.3 /100 | #93 | Exceptional 85.1% |
Demographics Similar to Immigrants from Portugal by In Labor Force | Age 25-29
In terms of in labor force | age 25-29, the demographic groups most similar to Immigrants from Portugal are Immigrants from Belgium (84.6%, a difference of 0.0%), Immigrants from Ukraine (84.5%, a difference of 0.010%), Immigrants from Denmark (84.6%, a difference of 0.020%), Moroccan (84.5%, a difference of 0.020%), and Immigrants from Kuwait (84.6%, a difference of 0.030%).
| Demographics | Rating | Rank | In Labor Force | Age 25-29 |
| Immigrants | South America | 42.9 /100 | #180 | Average 84.6% |
| Immigrants | Norway | 41.9 /100 | #181 | Average 84.6% |
| Europeans | 40.3 /100 | #182 | Average 84.6% |
| Scottish | 40.1 /100 | #183 | Average 84.6% |
| Immigrants | Kuwait | 38.2 /100 | #184 | Fair 84.6% |
| Immigrants | Denmark | 37.0 /100 | #185 | Fair 84.6% |
| Immigrants | Belgium | 35.0 /100 | #186 | Fair 84.6% |
| Immigrants | Portugal | 34.7 /100 | #187 | Fair 84.6% |
| Immigrants | Ukraine | 33.7 /100 | #188 | Fair 84.5% |
| Moroccans | 32.6 /100 | #189 | Fair 84.5% |
| Welsh | 31.1 /100 | #190 | Fair 84.5% |
| Zimbabweans | 28.7 /100 | #191 | Fair 84.5% |
| English | 25.8 /100 | #192 | Fair 84.5% |
| South American Indians | 25.0 /100 | #193 | Fair 84.5% |
| Portuguese | 21.2 /100 | #194 | Fair 84.4% |