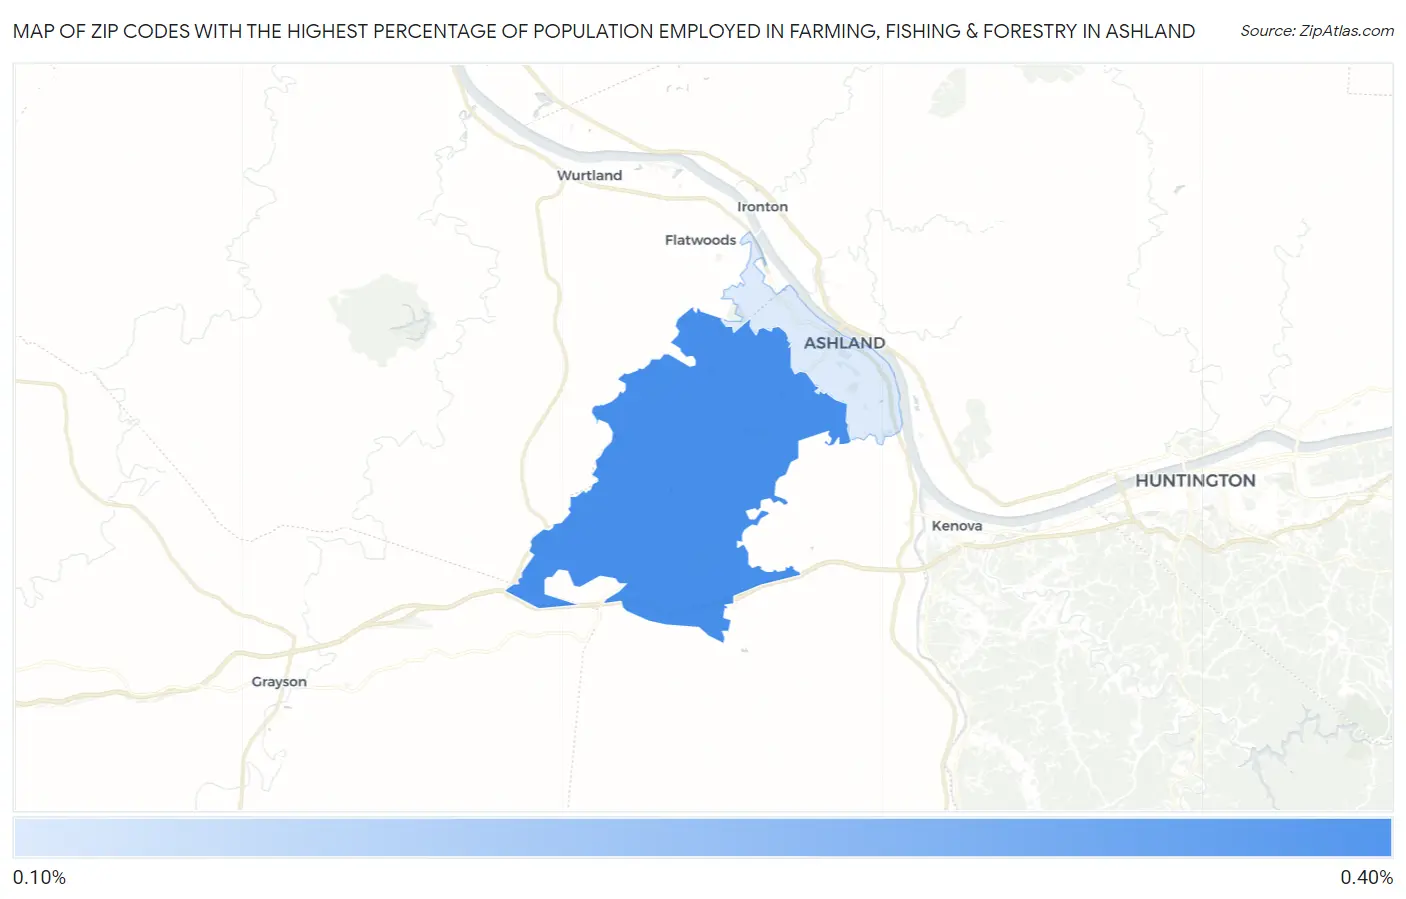
Zip Codes with the Highest Percentage of Population Employed in Farming, Fishing & Forestry in Ashland, KY
RELATED REPORTS & OPTIONS
Farming, Fishing & Forestry
Ashland
Compare Zip Codes
Map of Zip Codes with the Highest Percentage of Population Employed in Farming, Fishing & Forestry in Ashland
0.10%
0.31%
Zip Codes with the Highest Percentage of Population Employed in Farming, Fishing & Forestry in Ashland, KY
| Zip Code | % Employed | vs State | vs National | |
| 1. | 41102 | 0.31% | 0.52%(-0.205)#228 | 0.61%(-0.293)#14,692 |
| 2. | 41101 | 0.10% | 0.52%(-0.415)#285 | 0.61%(-0.503)#17,716 |
1
Common Questions
What are the Top Zip Codes with the Highest Percentage of Population Employed in Farming, Fishing & Forestry in Ashland, KY?
Top Zip Codes with the Highest Percentage of Population Employed in Farming, Fishing & Forestry in Ashland, KY are:
What zip code has the Highest Percentage of Population Employed in Farming, Fishing & Forestry in Ashland, KY?
41102 has the Highest Percentage of Population Employed in Farming, Fishing & Forestry in Ashland, KY with 0.31%.
What is the Percentage of Population Employed in Farming, Fishing & Forestry in Ashland, KY?
Percentage of Population Employed in Farming, Fishing & Forestry in Ashland is 0.092%.
What is the Percentage of Population Employed in Farming, Fishing & Forestry in Kentucky?
Percentage of Population Employed in Farming, Fishing & Forestry in Kentucky is 0.52%.
What is the Percentage of Population Employed in Farming, Fishing & Forestry in the United States?
Percentage of Population Employed in Farming, Fishing & Forestry in the United States is 0.61%.