Yuman vs Venezuelan Median Male Earnings
COMPARE
Yuman
Venezuelan
Median Male Earnings
Median Male Earnings Comparison
Yuman
Venezuelans
$45,446
MEDIAN MALE EARNINGS
0.0/ 100
METRIC RATING
325th/ 347
METRIC RANK
$52,510
MEDIAN MALE EARNINGS
12.5/ 100
METRIC RATING
208th/ 347
METRIC RANK
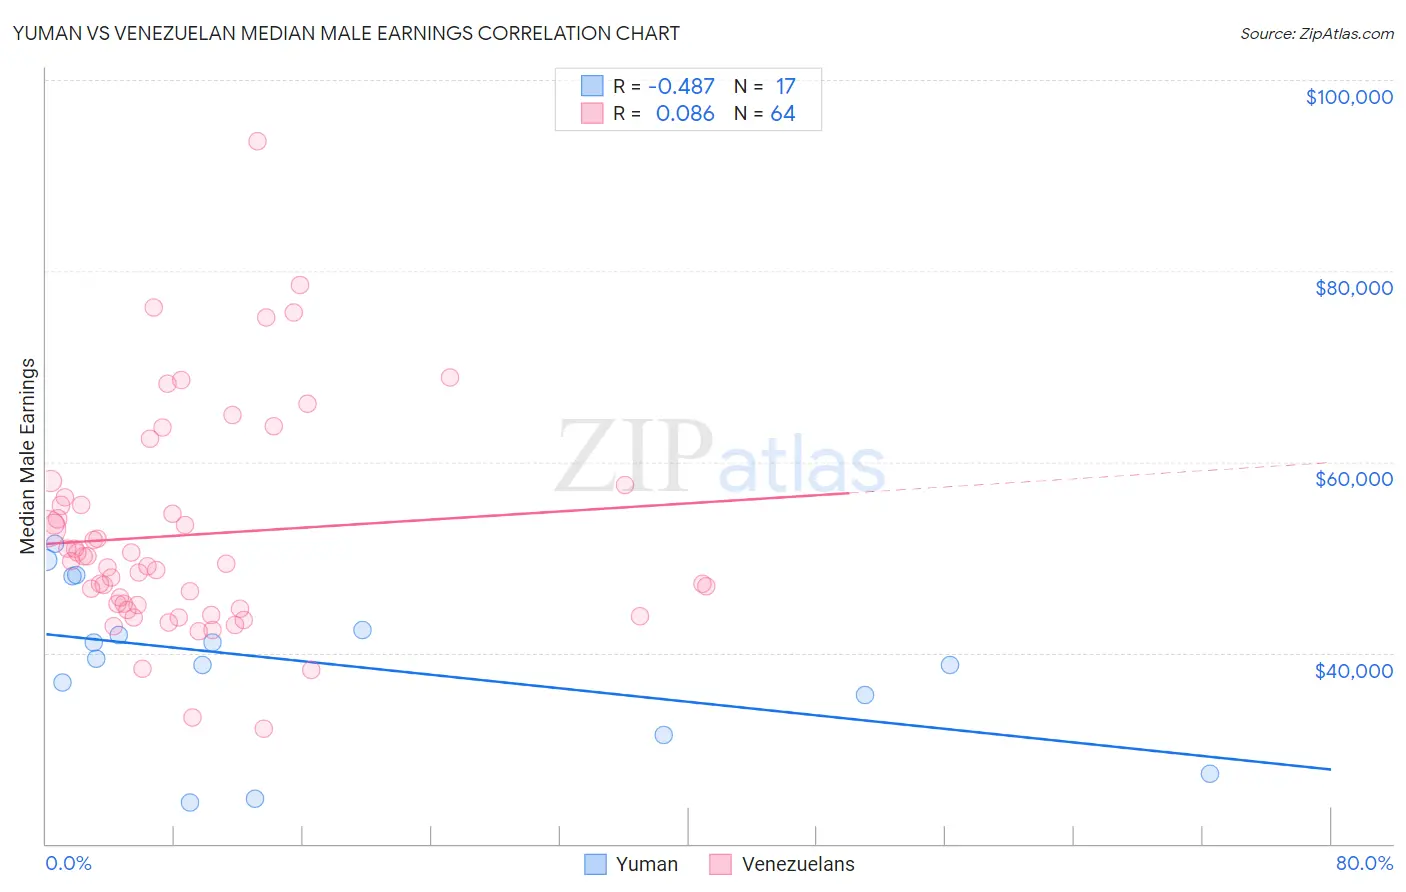
Yuman vs Venezuelan Median Male Earnings Correlation Chart
The statistical analysis conducted on geographies consisting of 40,680,371 people shows a moderate negative correlation between the proportion of Yuman and median male earnings in the United States with a correlation coefficient (R) of -0.487 and weighted average of $45,446. Similarly, the statistical analysis conducted on geographies consisting of 306,273,362 people shows a slight positive correlation between the proportion of Venezuelans and median male earnings in the United States with a correlation coefficient (R) of 0.086 and weighted average of $52,510, a difference of 15.5%.
Median Male Earnings Correlation Summary
| Measurement | Yuman | Venezuelan |
| Minimum | $24,301 | $32,054 |
| Maximum | $51,445 | $93,535 |
| Range | $27,144 | $61,481 |
| Mean | $38,868 | $52,370 |
| Median | $39,436 | $49,459 |
| Interquartile 25% (IQ1) | $33,507 | $44,807 |
| Interquartile 75% (IQ3) | $45,172 | $55,925 |
| Interquartile Range (IQR) | $11,665 | $11,117 |
| Standard Deviation (Sample) | $8,269 | $11,420 |
| Standard Deviation (Population) | $8,022 | $11,330 |
Similar Demographics by Median Male Earnings
Demographics Similar to Yuman by Median Male Earnings
In terms of median male earnings, the demographic groups most similar to Yuman are Black/African American ($45,523, a difference of 0.17%), Immigrants from Central America ($45,538, a difference of 0.20%), Sioux ($45,566, a difference of 0.26%), Fijian ($45,607, a difference of 0.35%), and Immigrants from Haiti ($45,266, a difference of 0.40%).
| Demographics | Rating | Rank | Median Male Earnings |
| Cheyenne | 0.0 /100 | #318 | Tragic $46,062 |
| Haitians | 0.0 /100 | #319 | Tragic $45,903 |
| Immigrants | Honduras | 0.0 /100 | #320 | Tragic $45,787 |
| Fijians | 0.0 /100 | #321 | Tragic $45,607 |
| Sioux | 0.0 /100 | #322 | Tragic $45,566 |
| Immigrants | Central America | 0.0 /100 | #323 | Tragic $45,538 |
| Blacks/African Americans | 0.0 /100 | #324 | Tragic $45,523 |
| Yuman | 0.0 /100 | #325 | Tragic $45,446 |
| Immigrants | Haiti | 0.0 /100 | #326 | Tragic $45,266 |
| Immigrants | Bahamas | 0.0 /100 | #327 | Tragic $45,176 |
| Kiowa | 0.0 /100 | #328 | Tragic $45,094 |
| Yakama | 0.0 /100 | #329 | Tragic $45,002 |
| Immigrants | Mexico | 0.0 /100 | #330 | Tragic $44,960 |
| Natives/Alaskans | 0.0 /100 | #331 | Tragic $44,775 |
| Bahamians | 0.0 /100 | #332 | Tragic $44,756 |
Demographics Similar to Venezuelans by Median Male Earnings
In terms of median male earnings, the demographic groups most similar to Venezuelans are Vietnamese ($52,525, a difference of 0.030%), Bermudan ($52,465, a difference of 0.090%), Delaware ($52,412, a difference of 0.19%), Tlingit-Haida ($52,409, a difference of 0.19%), and Immigrants from Iraq ($52,681, a difference of 0.33%).
| Demographics | Rating | Rank | Median Male Earnings |
| Immigrants | Bosnia and Herzegovina | 16.9 /100 | #201 | Poor $52,869 |
| Immigrants | Uruguay | 16.8 /100 | #202 | Poor $52,860 |
| Panamanians | 16.5 /100 | #203 | Poor $52,835 |
| Ghanaians | 16.1 /100 | #204 | Poor $52,810 |
| Immigrants | Colombia | 15.0 /100 | #205 | Poor $52,725 |
| Immigrants | Iraq | 14.5 /100 | #206 | Poor $52,681 |
| Vietnamese | 12.7 /100 | #207 | Poor $52,525 |
| Venezuelans | 12.5 /100 | #208 | Poor $52,510 |
| Bermudans | 12.1 /100 | #209 | Poor $52,465 |
| Delaware | 11.5 /100 | #210 | Poor $52,412 |
| Tlingit-Haida | 11.5 /100 | #211 | Poor $52,409 |
| Cajuns | 10.7 /100 | #212 | Poor $52,325 |
| Native Hawaiians | 10.5 /100 | #213 | Poor $52,306 |
| Immigrants | Nonimmigrants | 9.3 /100 | #214 | Tragic $52,170 |
| Immigrants | Cameroon | 8.9 /100 | #215 | Tragic $52,119 |