Immigrants from Africa vs Venezuelan Median Male Earnings
COMPARE
Immigrants from Africa
Venezuelan
Median Male Earnings
Median Male Earnings Comparison
Immigrants from Africa
Venezuelans
$53,457
MEDIAN MALE EARNINGS
26.6/ 100
METRIC RATING
196th/ 347
METRIC RANK
$52,510
MEDIAN MALE EARNINGS
12.5/ 100
METRIC RATING
208th/ 347
METRIC RANK
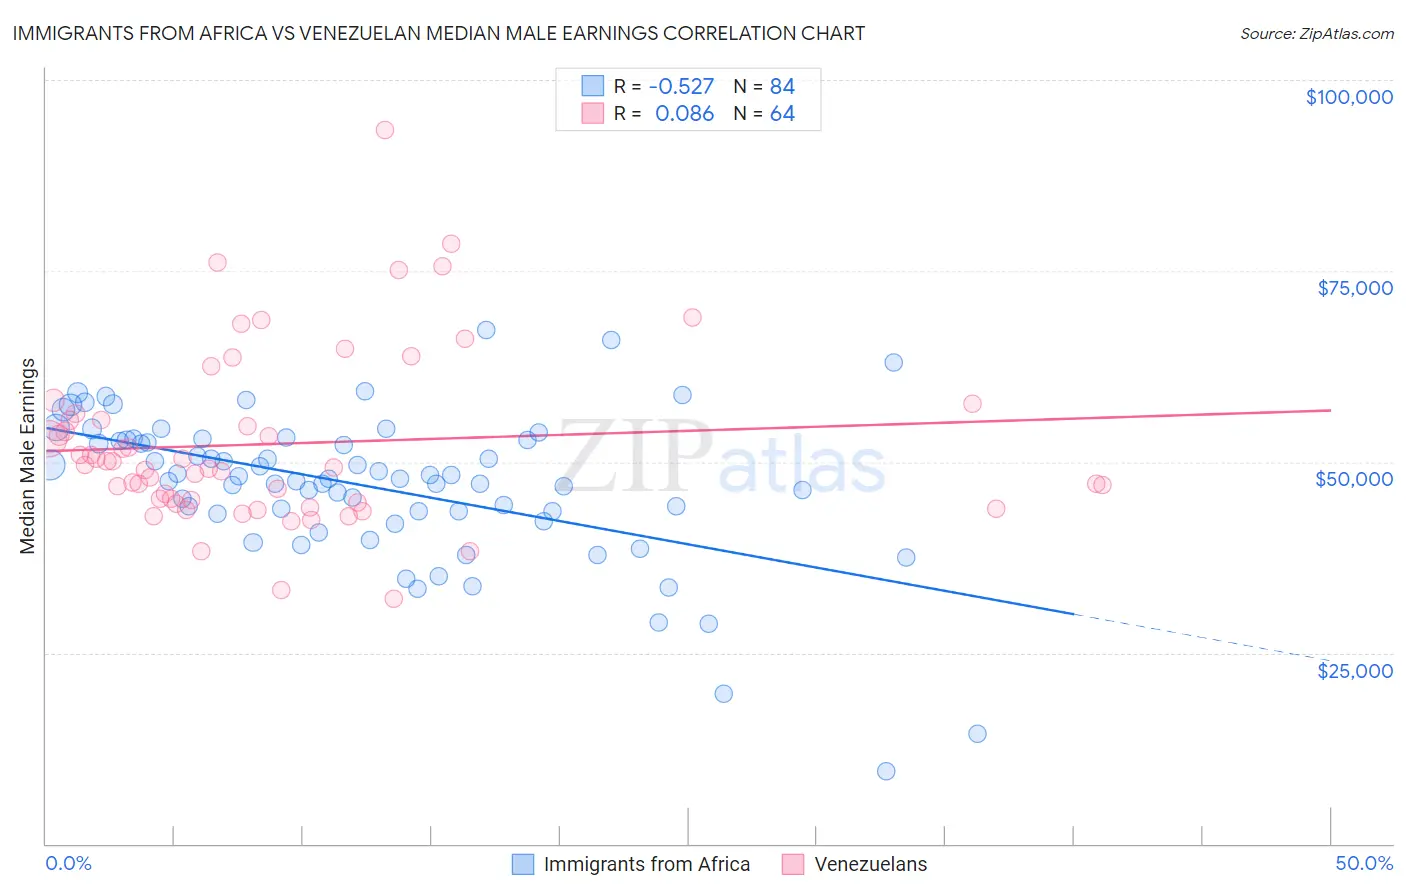
Immigrants from Africa vs Venezuelan Median Male Earnings Correlation Chart
The statistical analysis conducted on geographies consisting of 469,220,260 people shows a substantial negative correlation between the proportion of Immigrants from Africa and median male earnings in the United States with a correlation coefficient (R) of -0.527 and weighted average of $53,457. Similarly, the statistical analysis conducted on geographies consisting of 306,273,362 people shows a slight positive correlation between the proportion of Venezuelans and median male earnings in the United States with a correlation coefficient (R) of 0.086 and weighted average of $52,510, a difference of 1.8%.
Median Male Earnings Correlation Summary
| Measurement | Immigrants from Africa | Venezuelan |
| Minimum | $9,467 | $32,054 |
| Maximum | $67,337 | $93,535 |
| Range | $57,870 | $61,481 |
| Mean | $46,791 | $52,370 |
| Median | $47,827 | $49,459 |
| Interquartile 25% (IQ1) | $43,316 | $44,807 |
| Interquartile 75% (IQ3) | $52,867 | $55,925 |
| Interquartile Range (IQR) | $9,551 | $11,117 |
| Standard Deviation (Sample) | $9,958 | $11,420 |
| Standard Deviation (Population) | $9,899 | $11,330 |
Demographics Similar to Immigrants from Africa and Venezuelans by Median Male Earnings
In terms of median male earnings, the demographic groups most similar to Immigrants from Africa are Immigrants from Kenya ($53,427, a difference of 0.060%), Immigrants from the Azores ($53,503, a difference of 0.090%), Spanish ($53,576, a difference of 0.22%), Kenyan ($53,647, a difference of 0.36%), and Scotch-Irish ($53,658, a difference of 0.38%). Similarly, the demographic groups most similar to Venezuelans are Vietnamese ($52,525, a difference of 0.030%), Bermudan ($52,465, a difference of 0.090%), Delaware ($52,412, a difference of 0.19%), Tlingit-Haida ($52,409, a difference of 0.19%), and Immigrants from Iraq ($52,681, a difference of 0.33%).
| Demographics | Rating | Rank | Median Male Earnings |
| Scotch-Irish | 30.6 /100 | #192 | Fair $53,658 |
| Kenyans | 30.4 /100 | #193 | Fair $53,647 |
| Spanish | 29.0 /100 | #194 | Fair $53,576 |
| Immigrants | Azores | 27.5 /100 | #195 | Fair $53,503 |
| Immigrants | Africa | 26.6 /100 | #196 | Fair $53,457 |
| Immigrants | Kenya | 26.0 /100 | #197 | Fair $53,427 |
| Immigrants | Costa Rica | 22.6 /100 | #198 | Fair $53,237 |
| Tongans | 22.3 /100 | #199 | Fair $53,218 |
| Immigrants | Thailand | 17.5 /100 | #200 | Poor $52,908 |
| Immigrants | Bosnia and Herzegovina | 16.9 /100 | #201 | Poor $52,869 |
| Immigrants | Uruguay | 16.8 /100 | #202 | Poor $52,860 |
| Panamanians | 16.5 /100 | #203 | Poor $52,835 |
| Ghanaians | 16.1 /100 | #204 | Poor $52,810 |
| Immigrants | Colombia | 15.0 /100 | #205 | Poor $52,725 |
| Immigrants | Iraq | 14.5 /100 | #206 | Poor $52,681 |
| Vietnamese | 12.7 /100 | #207 | Poor $52,525 |
| Venezuelans | 12.5 /100 | #208 | Poor $52,510 |
| Bermudans | 12.1 /100 | #209 | Poor $52,465 |
| Delaware | 11.5 /100 | #210 | Poor $52,412 |
| Tlingit-Haida | 11.5 /100 | #211 | Poor $52,409 |
| Cajuns | 10.7 /100 | #212 | Poor $52,325 |