Yuman vs Yaqui Median Male Earnings
COMPARE
Yuman
Yaqui
Median Male Earnings
Median Male Earnings Comparison
Yuman
Yaqui
$45,446
MEDIAN MALE EARNINGS
0.0/ 100
METRIC RATING
325th/ 347
METRIC RANK
$46,777
MEDIAN MALE EARNINGS
0.1/ 100
METRIC RATING
303rd/ 347
METRIC RANK
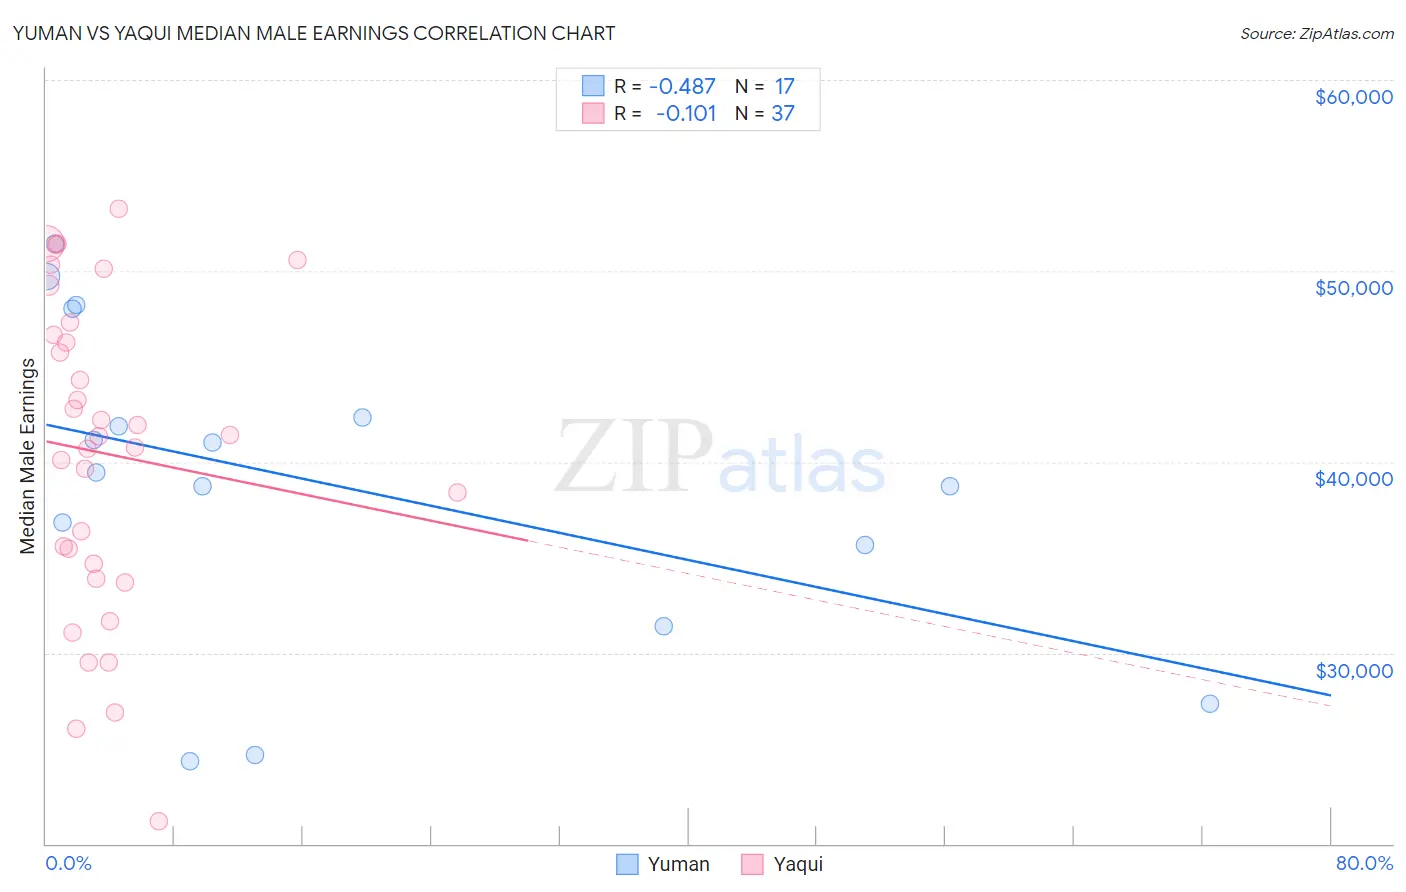
Yuman vs Yaqui Median Male Earnings Correlation Chart
The statistical analysis conducted on geographies consisting of 40,680,371 people shows a moderate negative correlation between the proportion of Yuman and median male earnings in the United States with a correlation coefficient (R) of -0.487 and weighted average of $45,446. Similarly, the statistical analysis conducted on geographies consisting of 107,723,867 people shows a poor negative correlation between the proportion of Yaqui and median male earnings in the United States with a correlation coefficient (R) of -0.101 and weighted average of $46,777, a difference of 2.9%.
Median Male Earnings Correlation Summary
| Measurement | Yuman | Yaqui |
| Minimum | $24,301 | $21,192 |
| Maximum | $51,445 | $53,274 |
| Range | $27,144 | $32,082 |
| Mean | $38,868 | $40,430 |
| Median | $39,436 | $41,328 |
| Interquartile 25% (IQ1) | $33,507 | $34,244 |
| Interquartile 75% (IQ3) | $45,172 | $46,983 |
| Interquartile Range (IQR) | $11,665 | $12,738 |
| Standard Deviation (Sample) | $8,269 | $8,232 |
| Standard Deviation (Population) | $8,022 | $8,120 |
Similar Demographics by Median Male Earnings
Demographics Similar to Yuman by Median Male Earnings
In terms of median male earnings, the demographic groups most similar to Yuman are Black/African American ($45,523, a difference of 0.17%), Immigrants from Central America ($45,538, a difference of 0.20%), Sioux ($45,566, a difference of 0.26%), Fijian ($45,607, a difference of 0.35%), and Immigrants from Haiti ($45,266, a difference of 0.40%).
| Demographics | Rating | Rank | Median Male Earnings |
| Cheyenne | 0.0 /100 | #318 | Tragic $46,062 |
| Haitians | 0.0 /100 | #319 | Tragic $45,903 |
| Immigrants | Honduras | 0.0 /100 | #320 | Tragic $45,787 |
| Fijians | 0.0 /100 | #321 | Tragic $45,607 |
| Sioux | 0.0 /100 | #322 | Tragic $45,566 |
| Immigrants | Central America | 0.0 /100 | #323 | Tragic $45,538 |
| Blacks/African Americans | 0.0 /100 | #324 | Tragic $45,523 |
| Yuman | 0.0 /100 | #325 | Tragic $45,446 |
| Immigrants | Haiti | 0.0 /100 | #326 | Tragic $45,266 |
| Immigrants | Bahamas | 0.0 /100 | #327 | Tragic $45,176 |
| Kiowa | 0.0 /100 | #328 | Tragic $45,094 |
| Yakama | 0.0 /100 | #329 | Tragic $45,002 |
| Immigrants | Mexico | 0.0 /100 | #330 | Tragic $44,960 |
| Natives/Alaskans | 0.0 /100 | #331 | Tragic $44,775 |
| Bahamians | 0.0 /100 | #332 | Tragic $44,756 |
Demographics Similar to Yaqui by Median Male Earnings
In terms of median male earnings, the demographic groups most similar to Yaqui are Seminole ($46,783, a difference of 0.010%), Bangladeshi ($46,744, a difference of 0.070%), Guatemalan ($46,736, a difference of 0.090%), Dutch West Indian ($46,656, a difference of 0.26%), and Immigrants from Dominican Republic ($46,655, a difference of 0.26%).
| Demographics | Rating | Rank | Median Male Earnings |
| Inupiat | 0.1 /100 | #296 | Tragic $47,281 |
| Dominicans | 0.1 /100 | #297 | Tragic $47,204 |
| Immigrants | Micronesia | 0.1 /100 | #298 | Tragic $47,177 |
| Immigrants | Zaire | 0.1 /100 | #299 | Tragic $47,070 |
| U.S. Virgin Islanders | 0.1 /100 | #300 | Tragic $47,066 |
| Immigrants | Latin America | 0.1 /100 | #301 | Tragic $46,941 |
| Seminole | 0.1 /100 | #302 | Tragic $46,783 |
| Yaqui | 0.1 /100 | #303 | Tragic $46,777 |
| Bangladeshis | 0.1 /100 | #304 | Tragic $46,744 |
| Guatemalans | 0.0 /100 | #305 | Tragic $46,736 |
| Dutch West Indians | 0.0 /100 | #306 | Tragic $46,656 |
| Immigrants | Dominican Republic | 0.0 /100 | #307 | Tragic $46,655 |
| Ottawa | 0.0 /100 | #308 | Tragic $46,611 |
| Creek | 0.0 /100 | #309 | Tragic $46,594 |
| Cubans | 0.0 /100 | #310 | Tragic $46,580 |