Belizean vs Venezuelan Median Male Earnings
COMPARE
Belizean
Venezuelan
Median Male Earnings
Median Male Earnings Comparison
Belizeans
Venezuelans
$48,358
MEDIAN MALE EARNINGS
0.2/ 100
METRIC RATING
277th/ 347
METRIC RANK
$52,510
MEDIAN MALE EARNINGS
12.5/ 100
METRIC RATING
208th/ 347
METRIC RANK
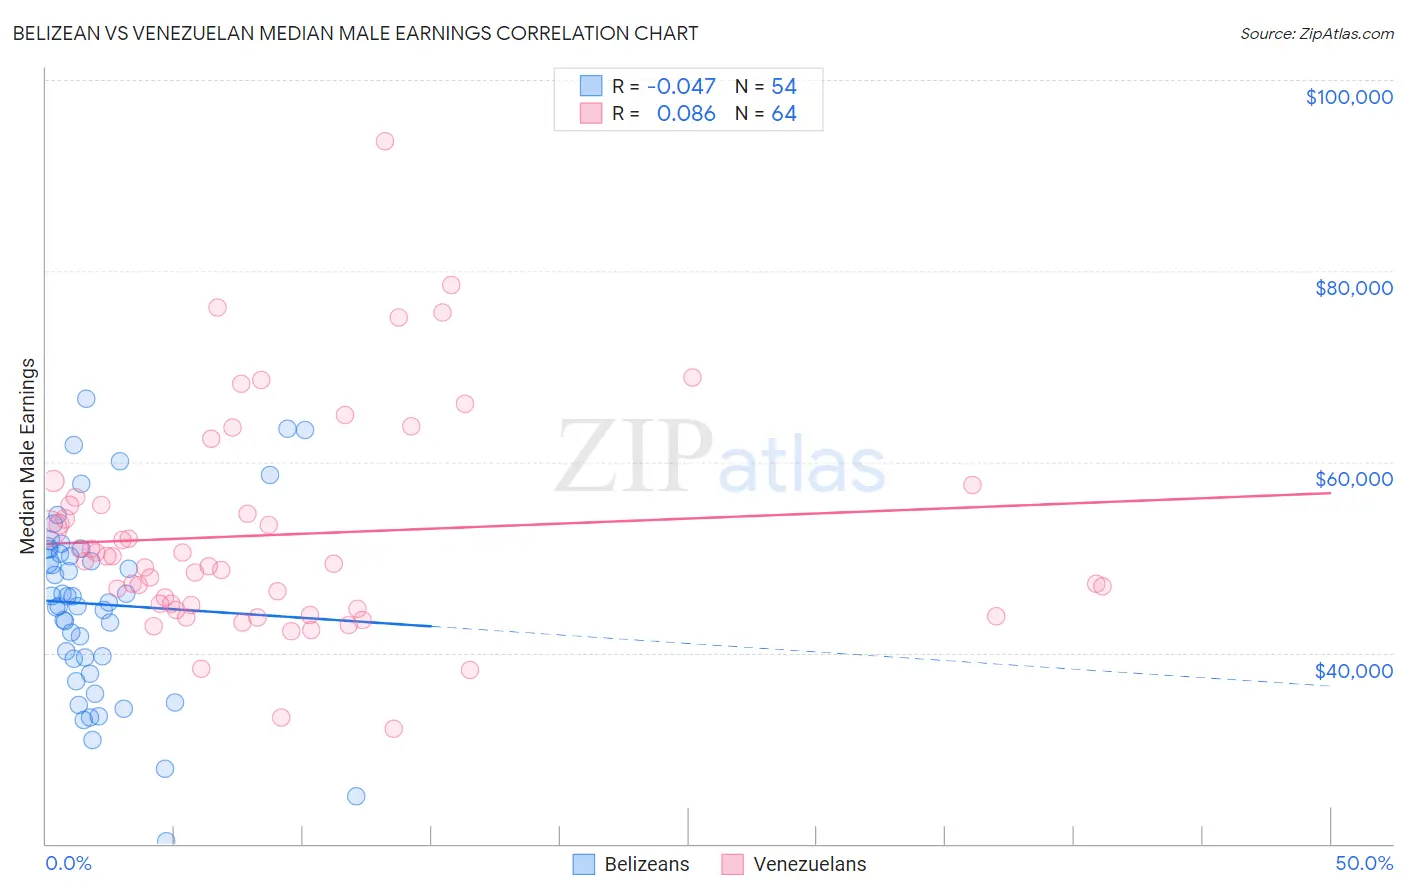
Belizean vs Venezuelan Median Male Earnings Correlation Chart
The statistical analysis conducted on geographies consisting of 144,207,760 people shows no correlation between the proportion of Belizeans and median male earnings in the United States with a correlation coefficient (R) of -0.047 and weighted average of $48,358. Similarly, the statistical analysis conducted on geographies consisting of 306,273,362 people shows a slight positive correlation between the proportion of Venezuelans and median male earnings in the United States with a correlation coefficient (R) of 0.086 and weighted average of $52,510, a difference of 8.6%.
Median Male Earnings Correlation Summary
| Measurement | Belizean | Venezuelan |
| Minimum | $20,292 | $32,054 |
| Maximum | $66,580 | $93,535 |
| Range | $46,288 | $61,481 |
| Mean | $45,078 | $52,370 |
| Median | $45,641 | $49,459 |
| Interquartile 25% (IQ1) | $39,349 | $44,807 |
| Interquartile 75% (IQ3) | $50,831 | $55,925 |
| Interquartile Range (IQR) | $11,482 | $11,117 |
| Standard Deviation (Sample) | $9,817 | $11,420 |
| Standard Deviation (Population) | $9,725 | $11,330 |
Similar Demographics by Median Male Earnings
Demographics Similar to Belizeans by Median Male Earnings
In terms of median male earnings, the demographic groups most similar to Belizeans are Immigrants from Liberia ($48,317, a difference of 0.080%), Blackfeet ($48,402, a difference of 0.090%), Immigrants from Somalia ($48,439, a difference of 0.17%), Hmong ($48,254, a difference of 0.22%), and Comanche ($48,202, a difference of 0.32%).
| Demographics | Rating | Rank | Median Male Earnings |
| Potawatomi | 0.4 /100 | #270 | Tragic $48,768 |
| Cherokee | 0.3 /100 | #271 | Tragic $48,669 |
| Salvadorans | 0.3 /100 | #272 | Tragic $48,646 |
| Jamaicans | 0.3 /100 | #273 | Tragic $48,632 |
| Colville | 0.3 /100 | #274 | Tragic $48,516 |
| Immigrants | Somalia | 0.3 /100 | #275 | Tragic $48,439 |
| Blackfeet | 0.3 /100 | #276 | Tragic $48,402 |
| Belizeans | 0.2 /100 | #277 | Tragic $48,358 |
| Immigrants | Liberia | 0.2 /100 | #278 | Tragic $48,317 |
| Hmong | 0.2 /100 | #279 | Tragic $48,254 |
| Comanche | 0.2 /100 | #280 | Tragic $48,202 |
| Marshallese | 0.2 /100 | #281 | Tragic $48,137 |
| Central Americans | 0.2 /100 | #282 | Tragic $48,093 |
| Immigrants | Jamaica | 0.2 /100 | #283 | Tragic $48,040 |
| Africans | 0.2 /100 | #284 | Tragic $47,994 |
Demographics Similar to Venezuelans by Median Male Earnings
In terms of median male earnings, the demographic groups most similar to Venezuelans are Vietnamese ($52,525, a difference of 0.030%), Bermudan ($52,465, a difference of 0.090%), Delaware ($52,412, a difference of 0.19%), Tlingit-Haida ($52,409, a difference of 0.19%), and Immigrants from Iraq ($52,681, a difference of 0.33%).
| Demographics | Rating | Rank | Median Male Earnings |
| Immigrants | Bosnia and Herzegovina | 16.9 /100 | #201 | Poor $52,869 |
| Immigrants | Uruguay | 16.8 /100 | #202 | Poor $52,860 |
| Panamanians | 16.5 /100 | #203 | Poor $52,835 |
| Ghanaians | 16.1 /100 | #204 | Poor $52,810 |
| Immigrants | Colombia | 15.0 /100 | #205 | Poor $52,725 |
| Immigrants | Iraq | 14.5 /100 | #206 | Poor $52,681 |
| Vietnamese | 12.7 /100 | #207 | Poor $52,525 |
| Venezuelans | 12.5 /100 | #208 | Poor $52,510 |
| Bermudans | 12.1 /100 | #209 | Poor $52,465 |
| Delaware | 11.5 /100 | #210 | Poor $52,412 |
| Tlingit-Haida | 11.5 /100 | #211 | Poor $52,409 |
| Cajuns | 10.7 /100 | #212 | Poor $52,325 |
| Native Hawaiians | 10.5 /100 | #213 | Poor $52,306 |
| Immigrants | Nonimmigrants | 9.3 /100 | #214 | Tragic $52,170 |
| Immigrants | Cameroon | 8.9 /100 | #215 | Tragic $52,119 |